SIEM Tutorial - Part 2

Table of Contents
- SIEM Solutions (Splunk)
- Introduction to Splunk
- How Splunk Works
- Splunk Components
- Splunk Interface
- Splunk Demo
SIEM Solutions (Splunk)
Hello analysts, today I’m back with the second part of the SIEM tutorial. In the first part, we discussed logs and events, understanding log monitoring and analysis, how to perform it, and we took a look at what SIEM is along with its benefits and solutions.
Today, we will explore one of the most widely used SIEM solutions: Splunk. Without wasting time, let’s delve into Splunk.
We’ll cover:
- Introduction to Splunk
- How Splunk works
- Explanation of Splunk components
Introduction to Splunk
Splunk is one of the leading SIEM tools with the ability to collect, analyze, and correlate network and machine data in real-time.
Machine data: This is generated from security technologies such as network, endpoint, access, malware, vulnerability, and identity information, or any data created by users.
How Splunk works
Splunk works by collecting, storing, and aggregating data from different sources, indexing it in a searchable format, and then providing powerful search and reporting capabilities to help users monitor systems and applications. Splunk can collect data from various sources, including logs, metrics, and events.
Splunk components
Forwarder
Splunk Forwarder is a lightweight agent installed on the endpoint intended to be monitored. It is used to collect data and send it to the indexer. It does not significantly affect the endpoint’s performance as it uses very few resources. You can use Forwarder for real-time monitoring, configuring it on the machine you want to monitor to send data to Splunk indexers.
Universal Forwarder
The Universal Forwarder is a simple component. It is used to forward data only without indexing or making changes to the data.
When using the Universal Forwarder, the indexer will parse and then index the data.
Heavy Forwarder
The Heavy Forwarder also forwards data to the indexer, but it performs parsing and indexing at the source. It intelligently routes the data to the indexer, saving on bandwidth and storage space.
When using the Heavy Forwarder, the indexer will index the data only.
Indexer
After data is forwarded, the indexer indexes and stores it. The Splunk instance transforms raw data into events and stores them in indexes for performing search operations.
Search Head
With data being forwarded and indexed, you can search for what you want using the search head. Splunk uses Search Processing Language (SPL) to get the desired results from the datasets.
Some SPL commands used while searching:
table: Specifies fields to keep in the result set, retaining data in a tabular format.rename: Renames a field; you can use wildcards for multiple fields.dedup: Removes duplicate results that match certain criteria.sort: Sorts the results by the specified field, which can be in ascending or descending order.head/tail: Returns the top/bottom N results.
Splunk Interface
Now that we know what Splunk is and its components, let’s move to the application and explore it.
First, let’s download Splunk:
- Go to Splunk Download.
- Login/Register for an account.
- Download the Splunk Enterprise Windows version (I will use it for this tutorial).
- Start the installation process and follow the instructions.

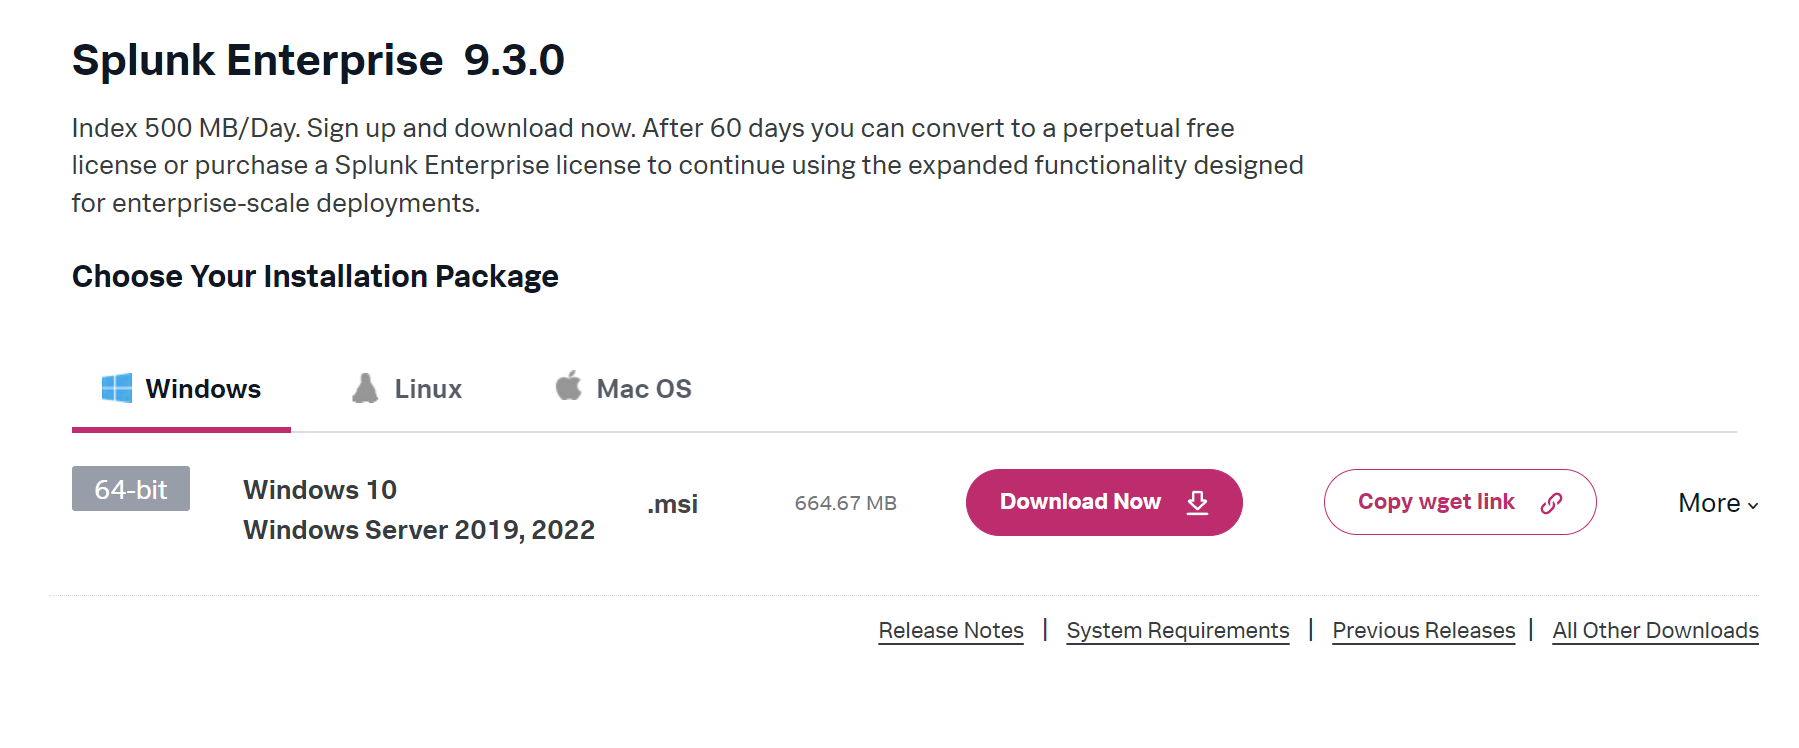
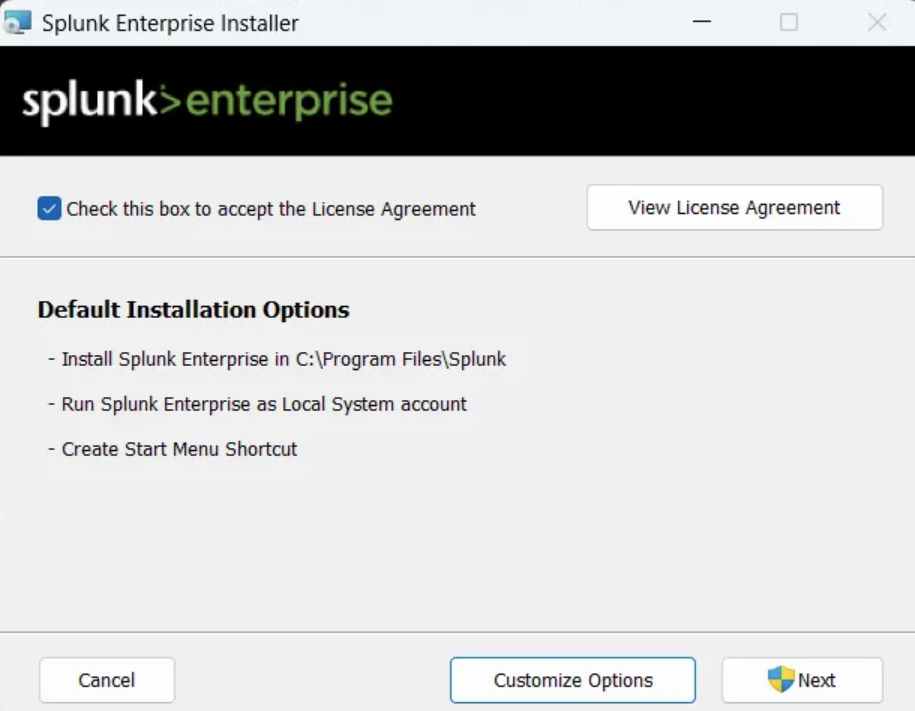
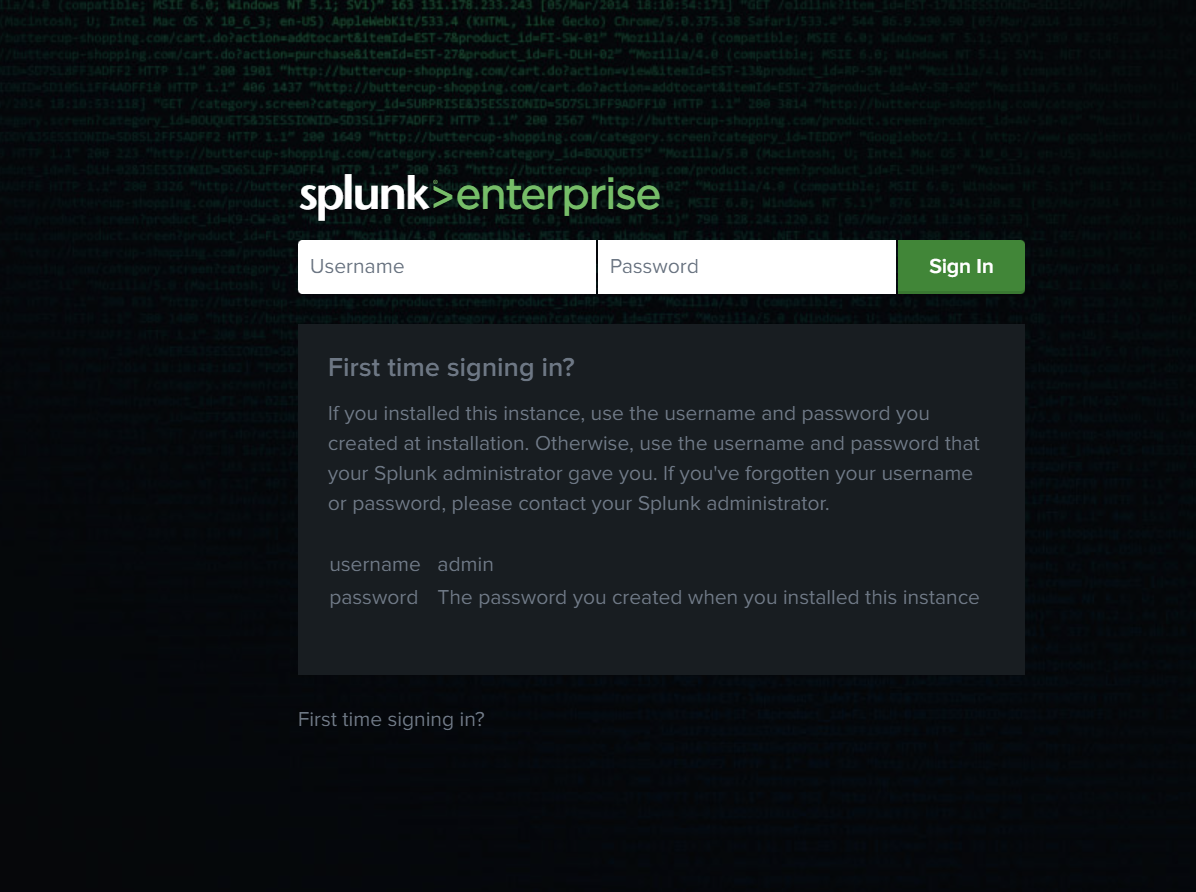
Now open Splunk and enter the login credentials from the above installation.
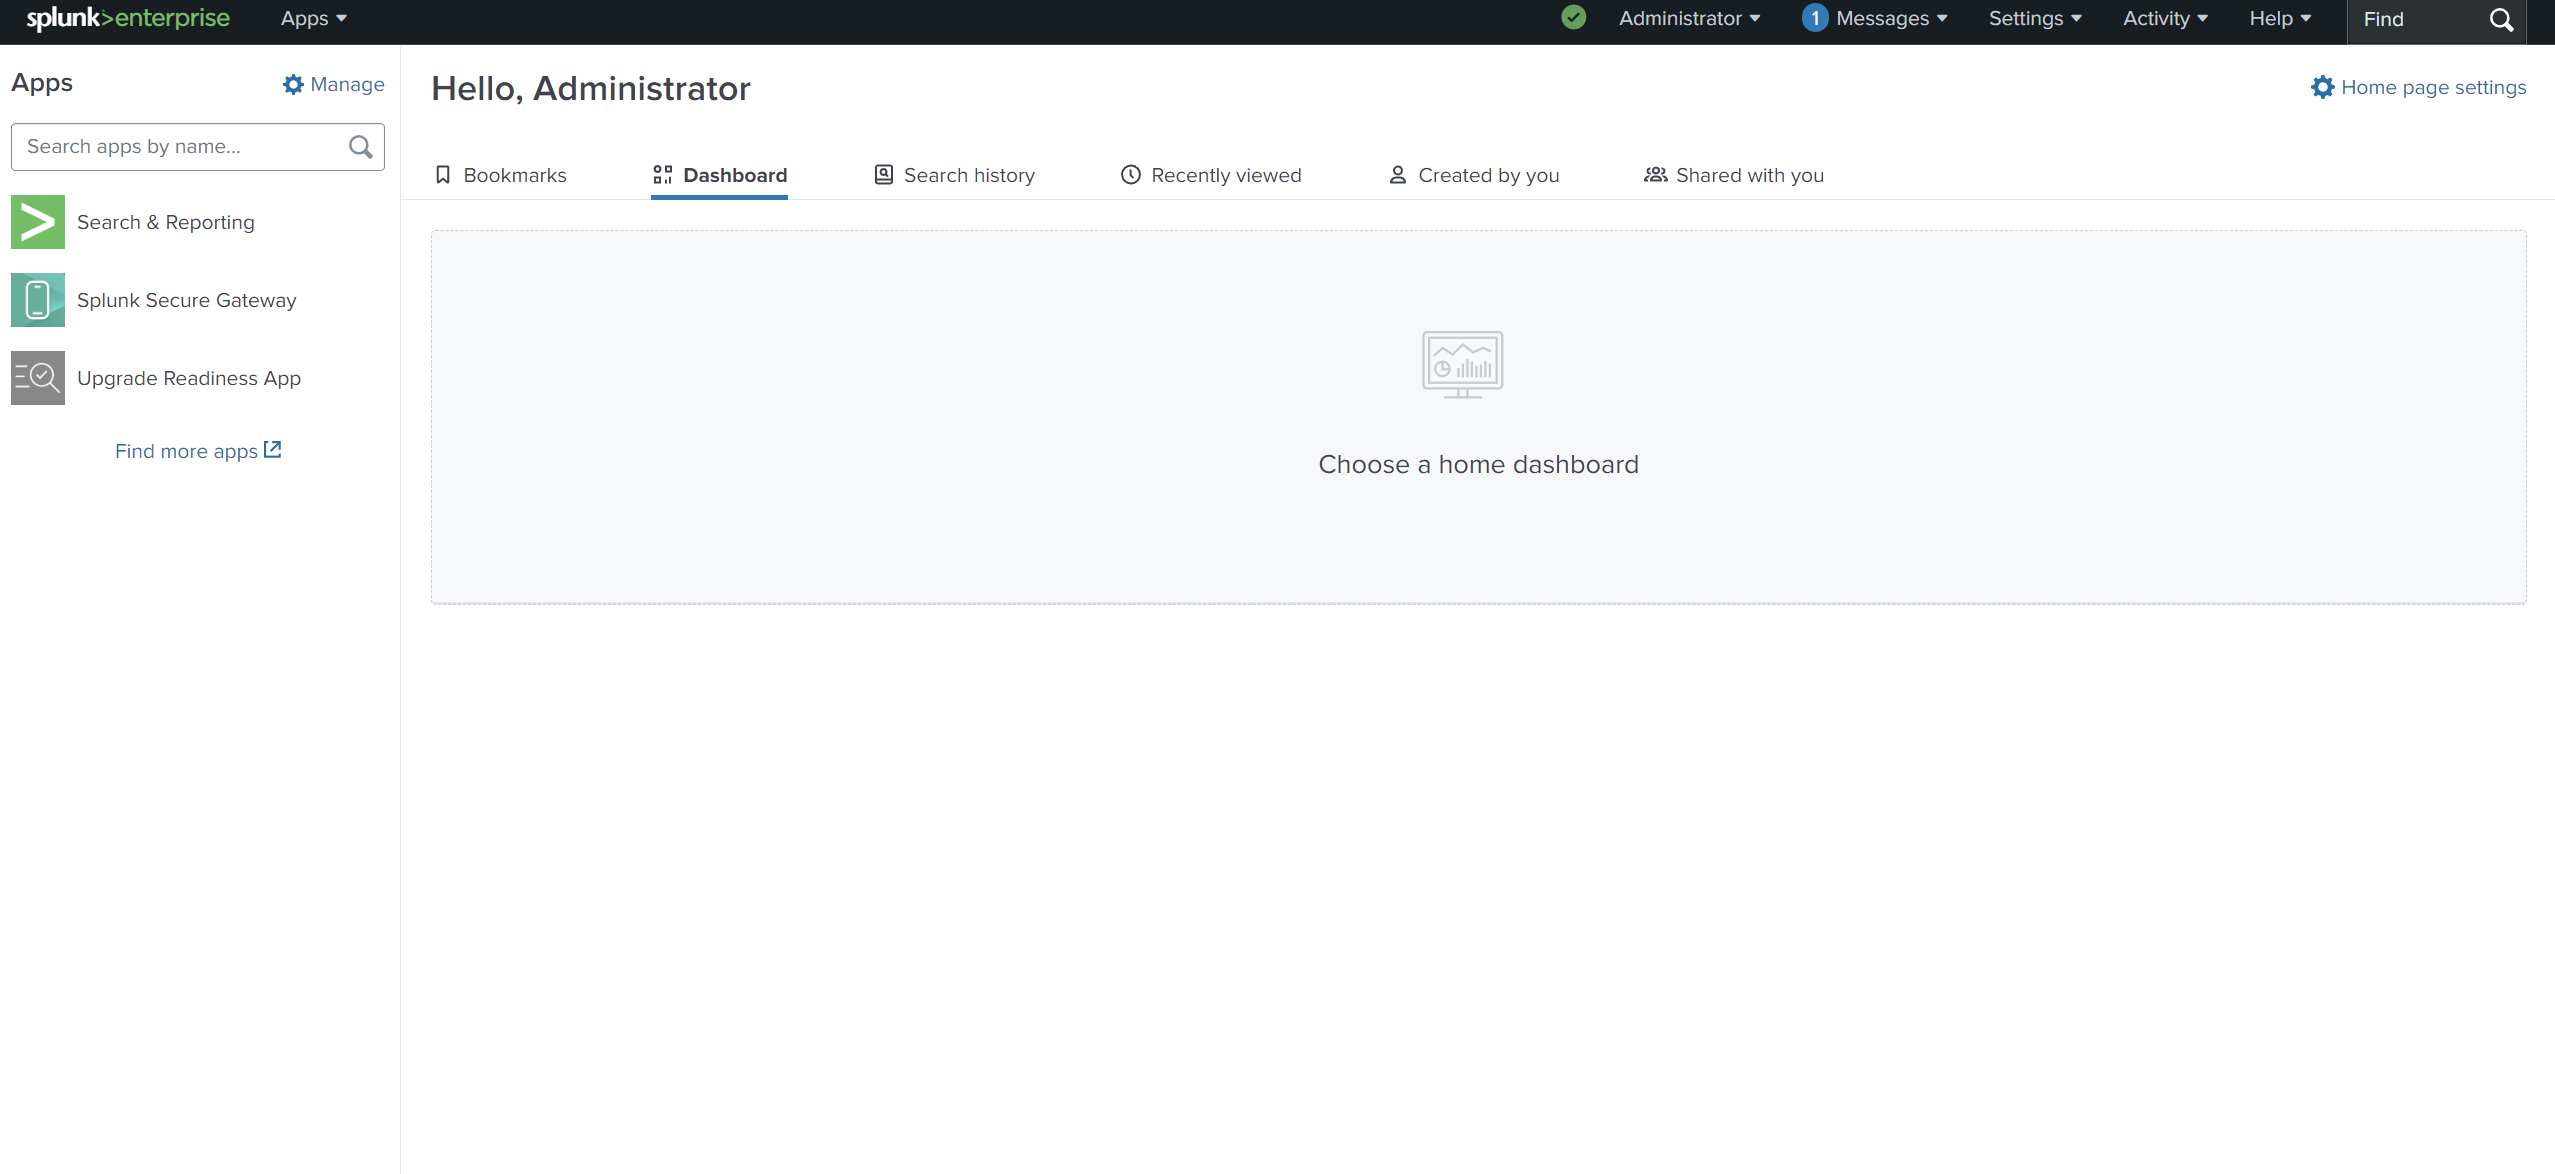
We can see above there are different sections in the app, let’s explore some of them:
Search & Reporting
Here we can search for logs. We can see the latest search queries that we used in Search history.
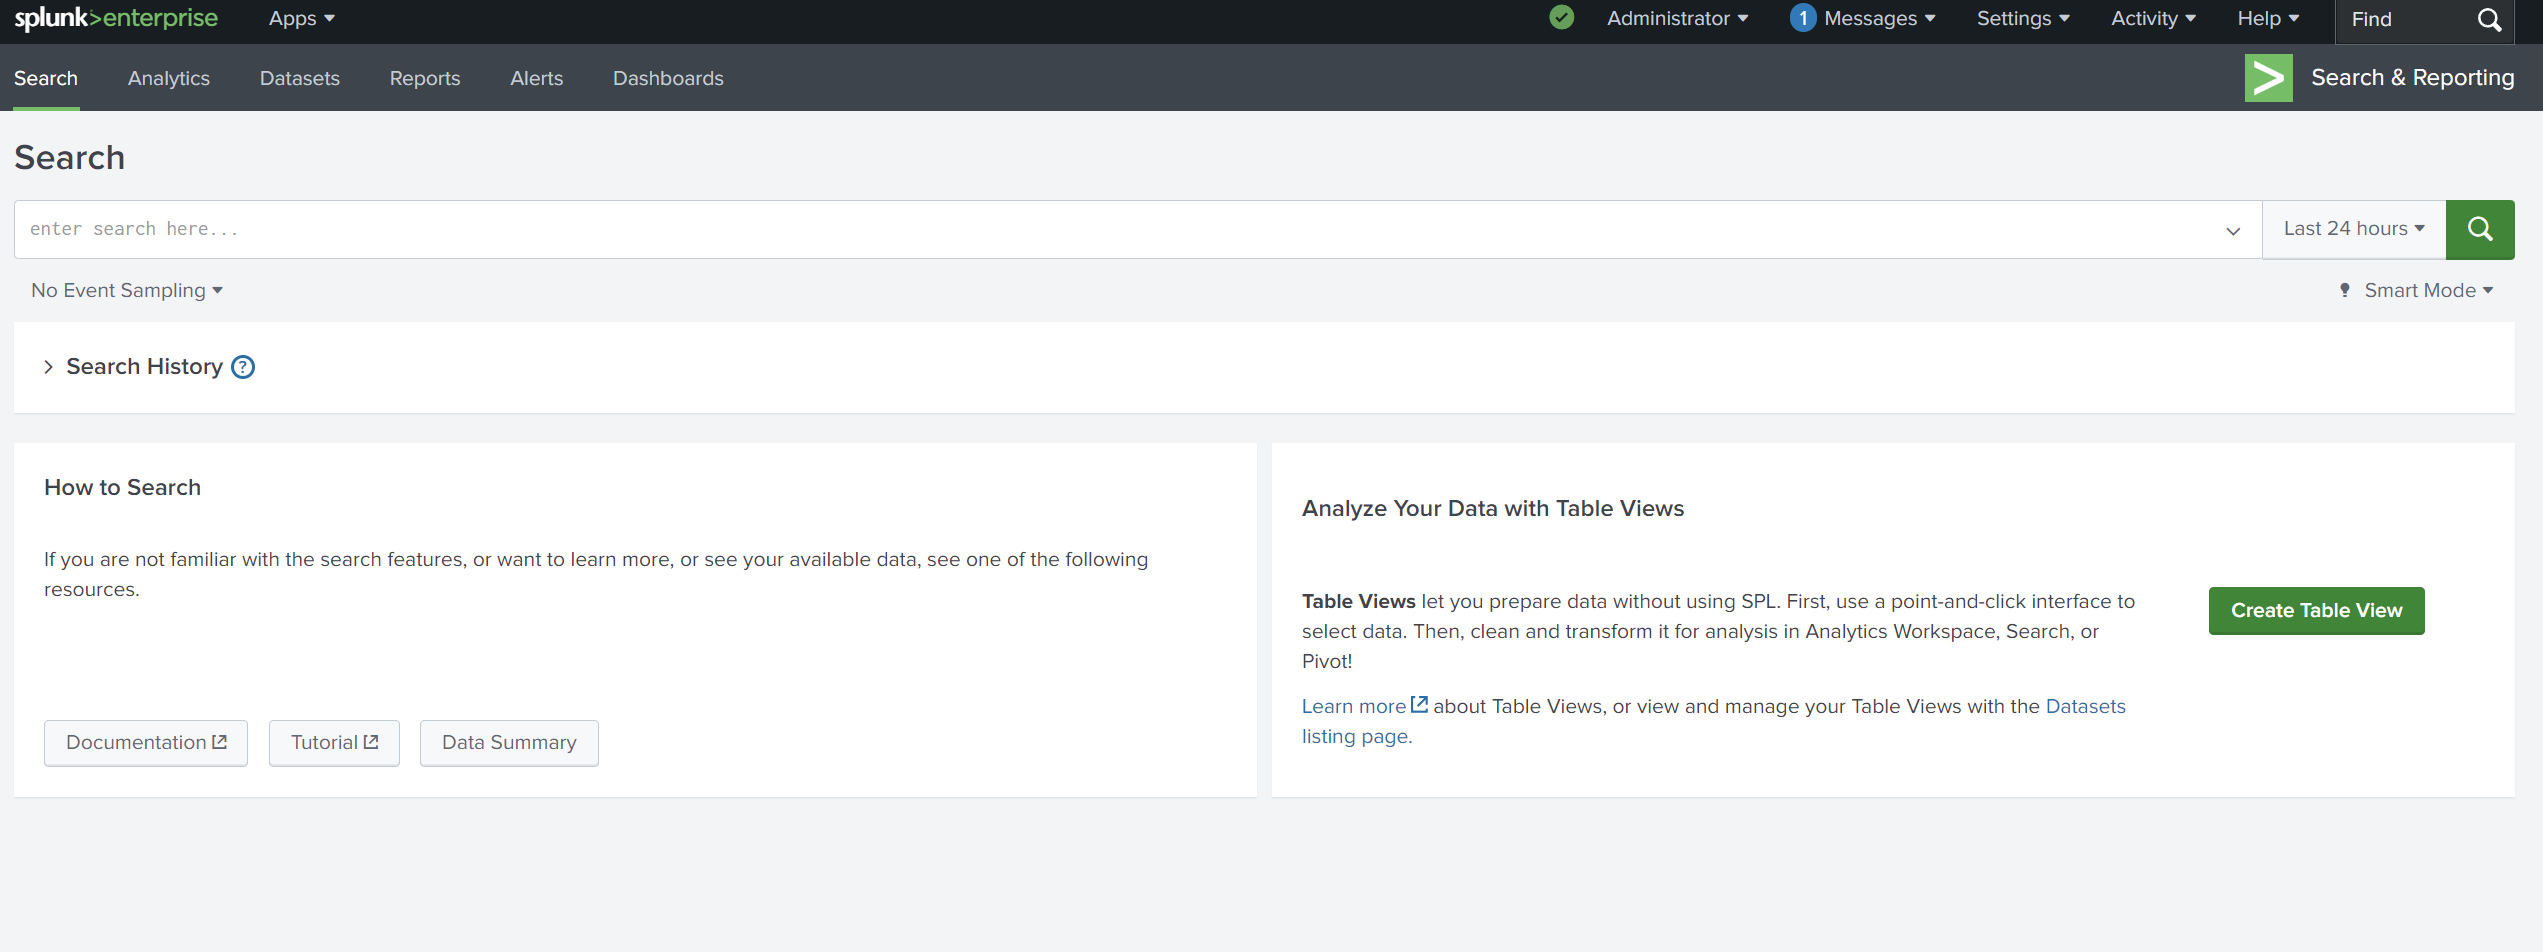
We can see latest search queries that we use in Search history.

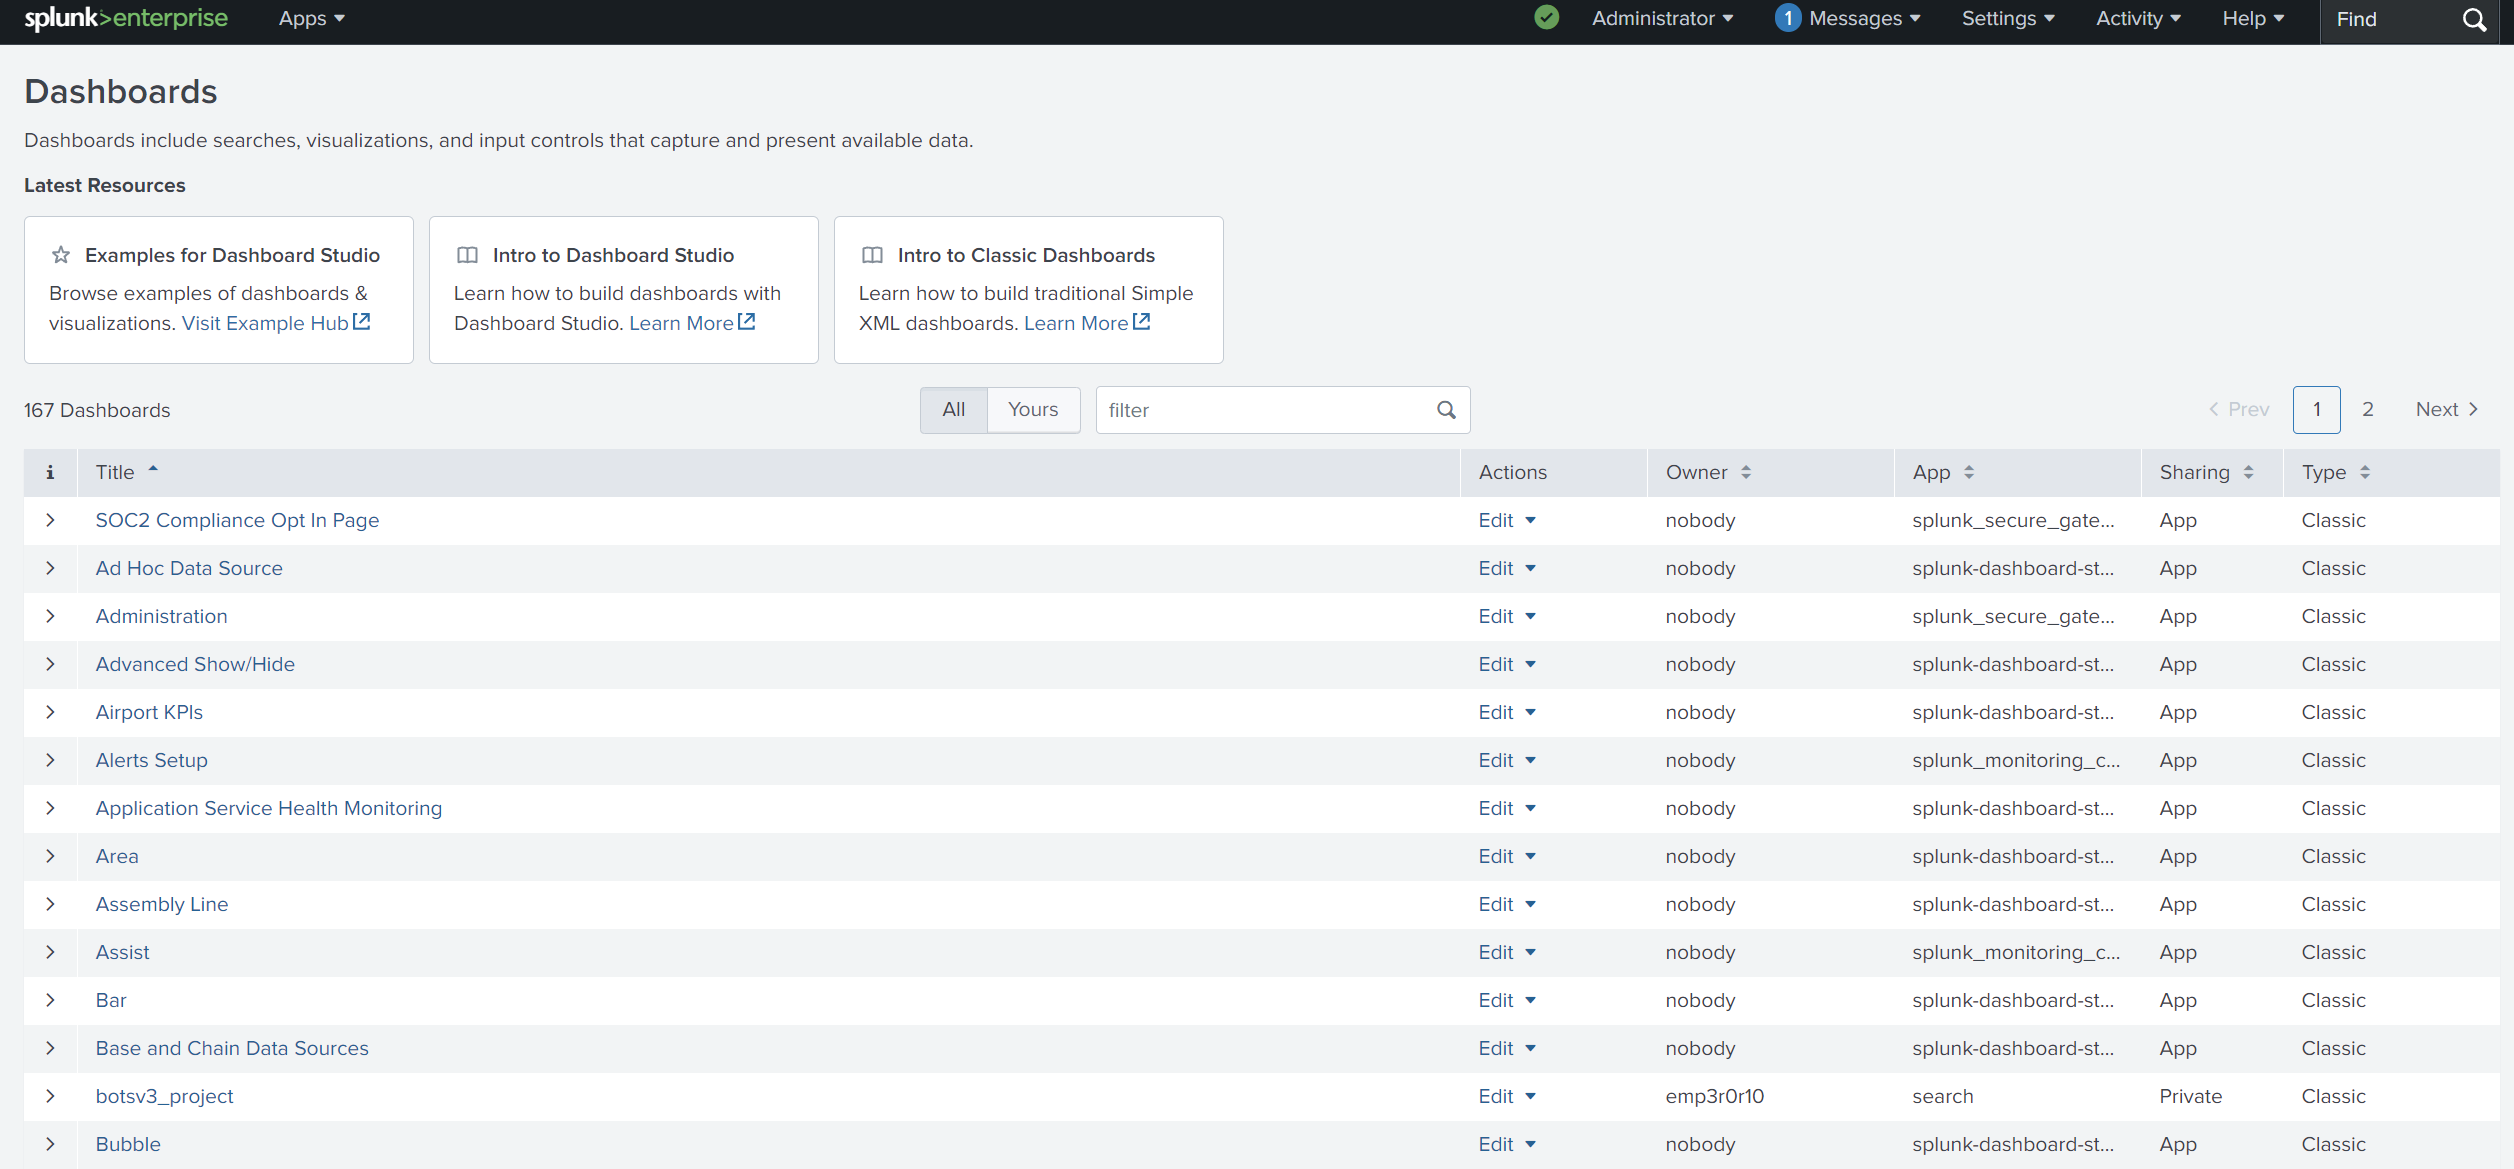
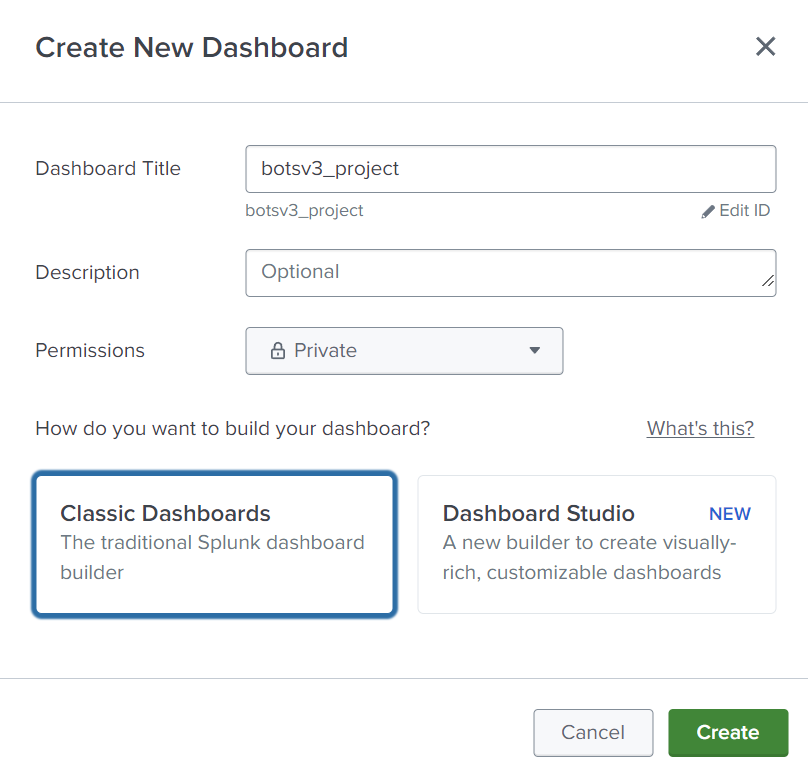
Dashboard
We can save our project to an existing dashboard or new one.
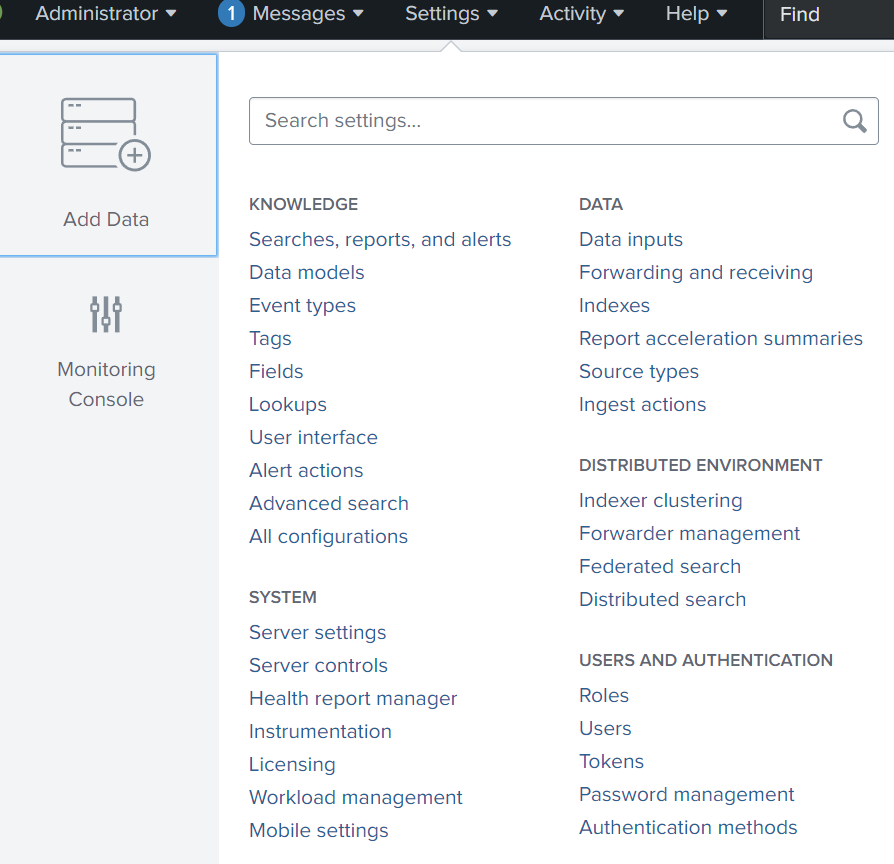
Add Data
As Splunk can ingest any data, we can add data using three ways:
- Upload a file (CSV or JSON)
- Monitor
- Forwarder (we will use it in the third part)
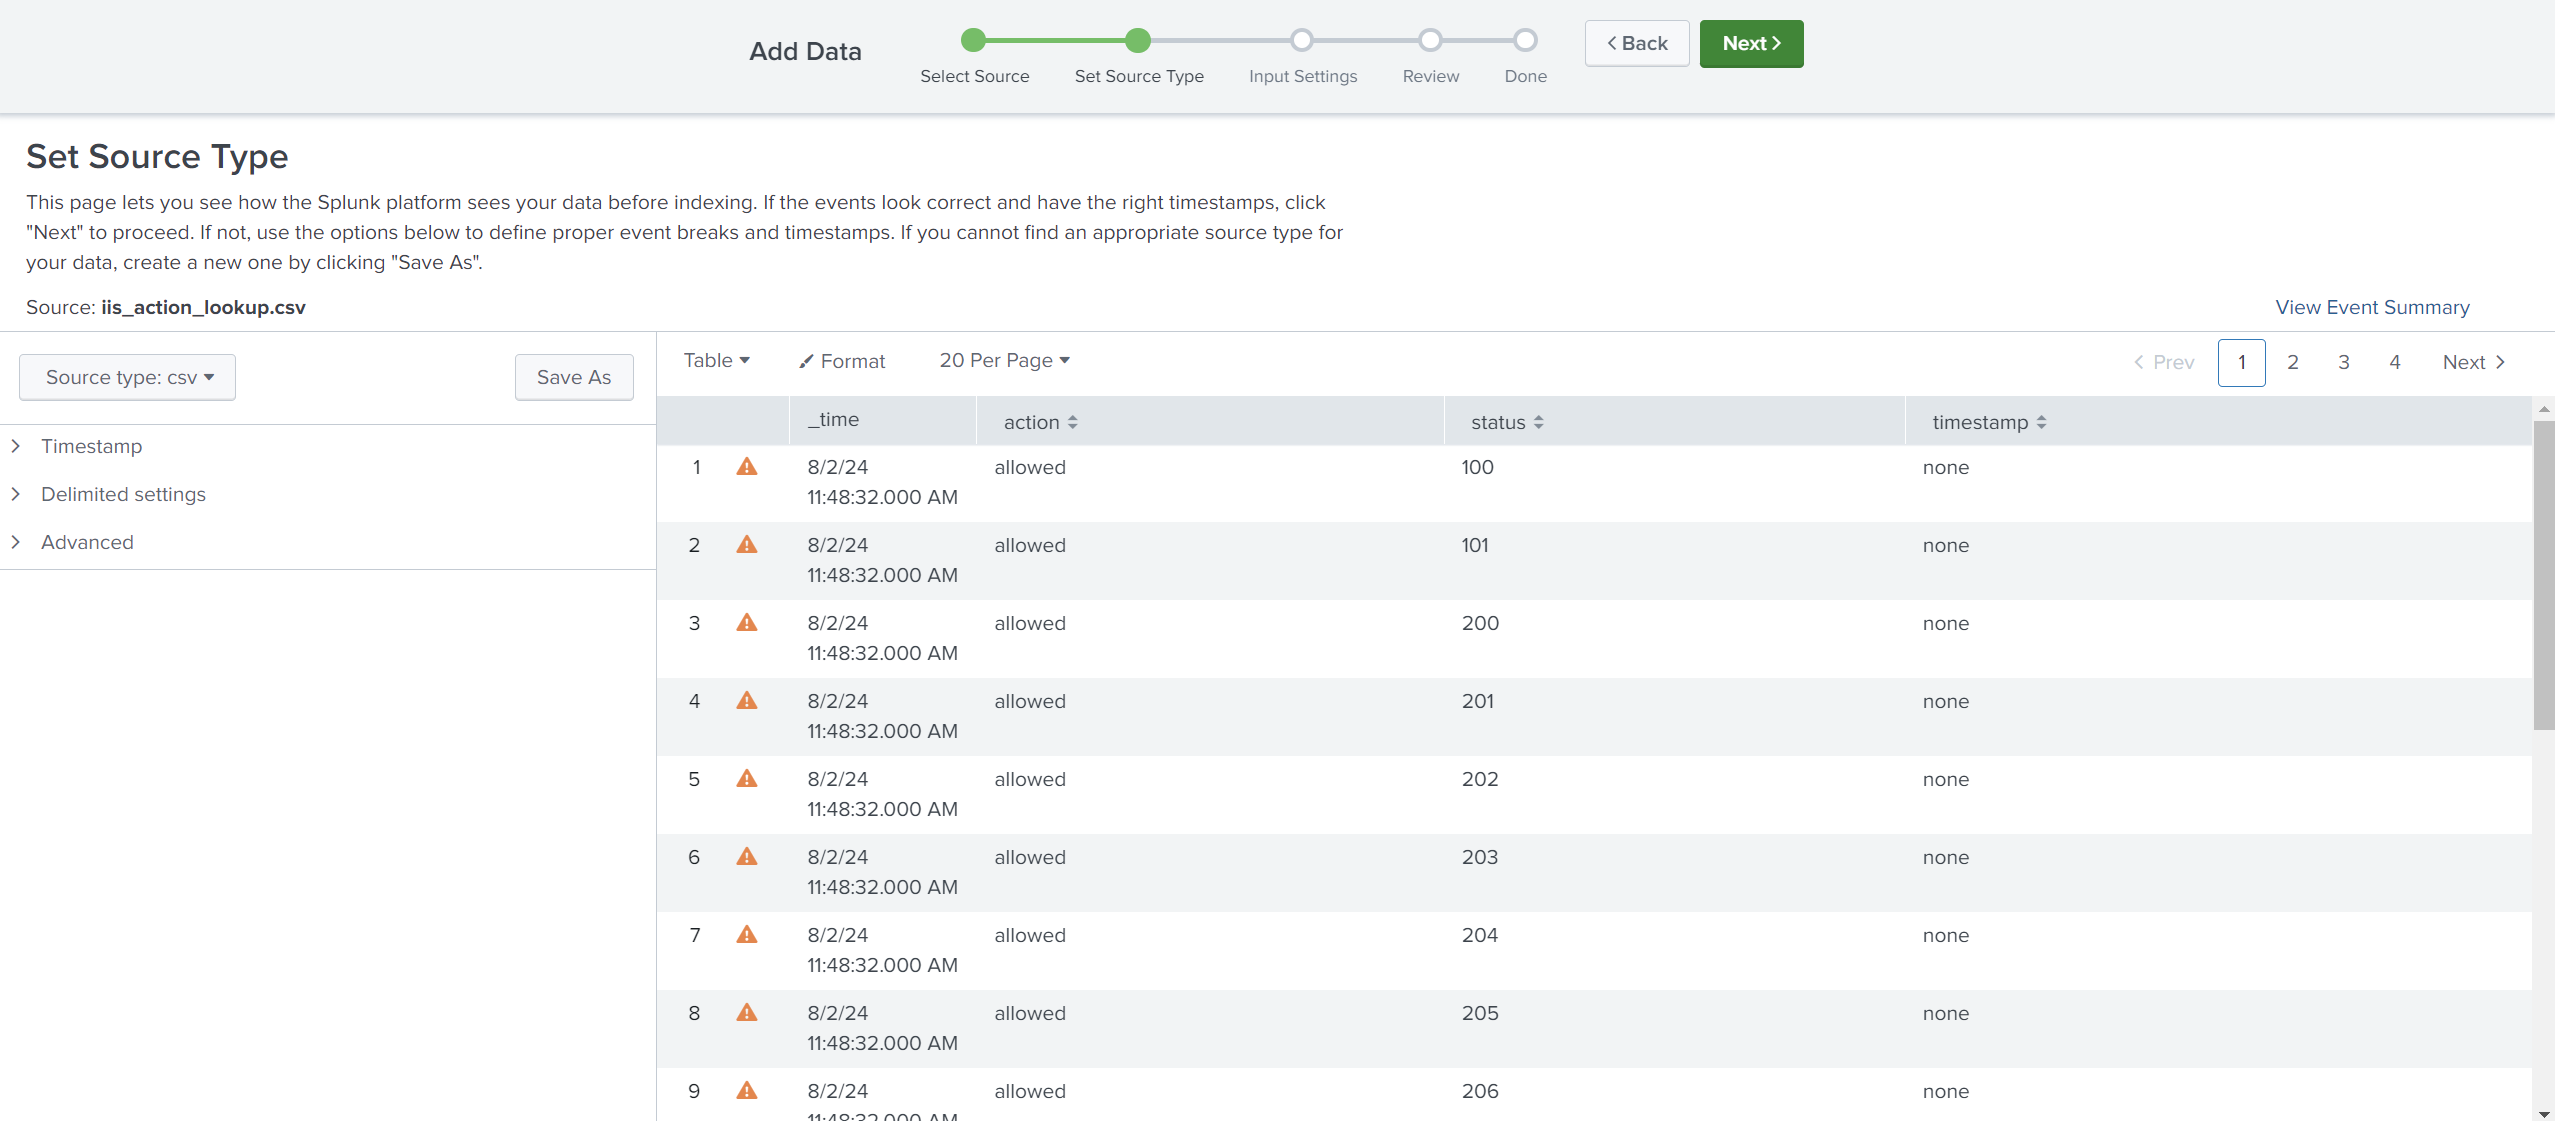
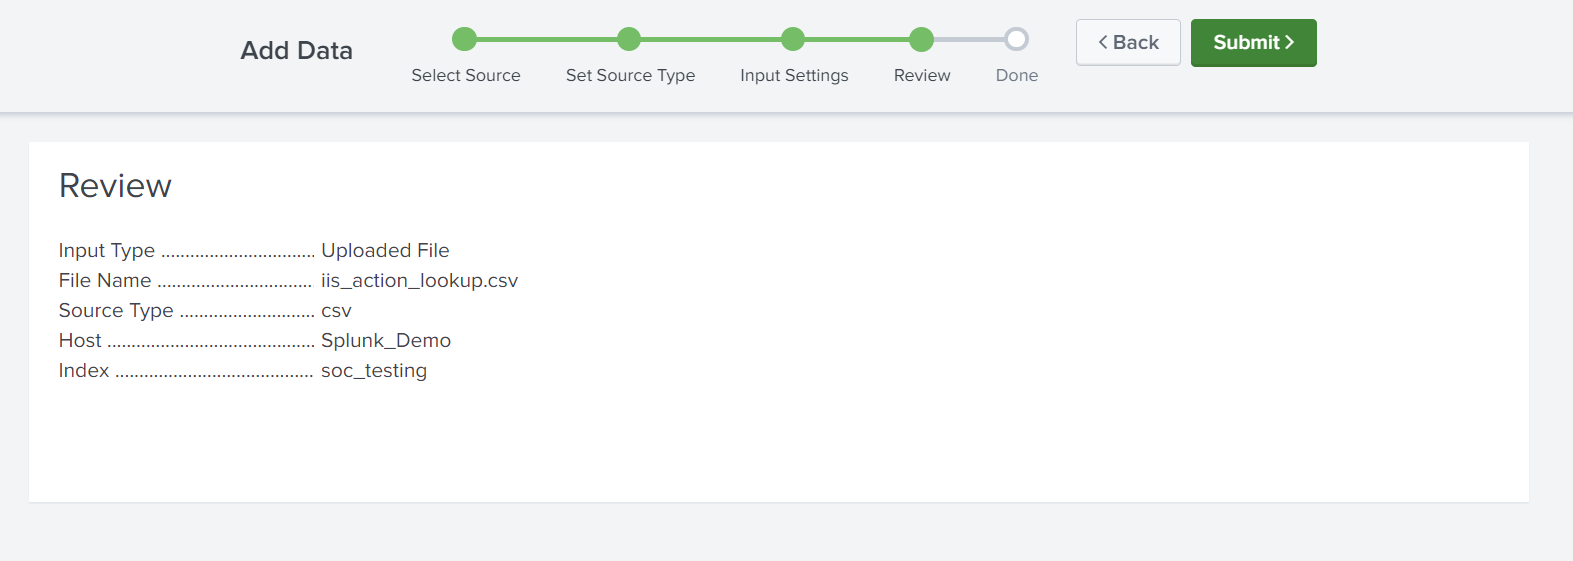
Let’s try to upload a .csv file. Ensure the source type is csv.
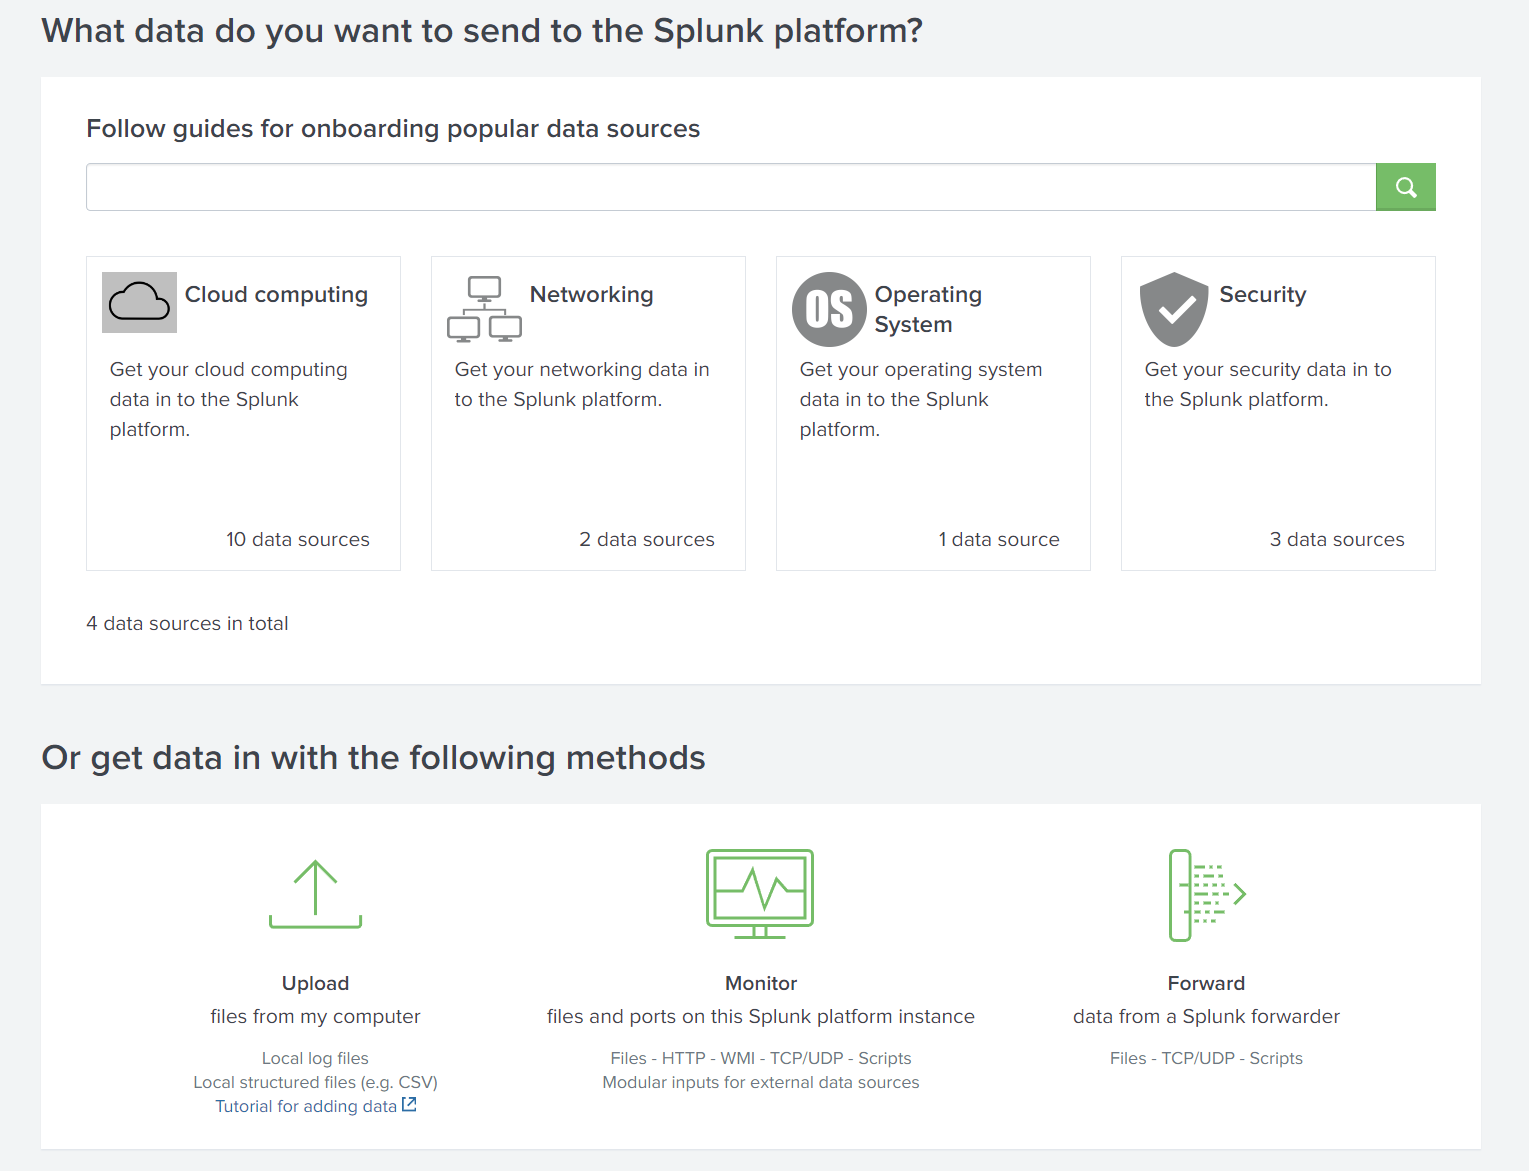
Let’s try to upload .csv file.
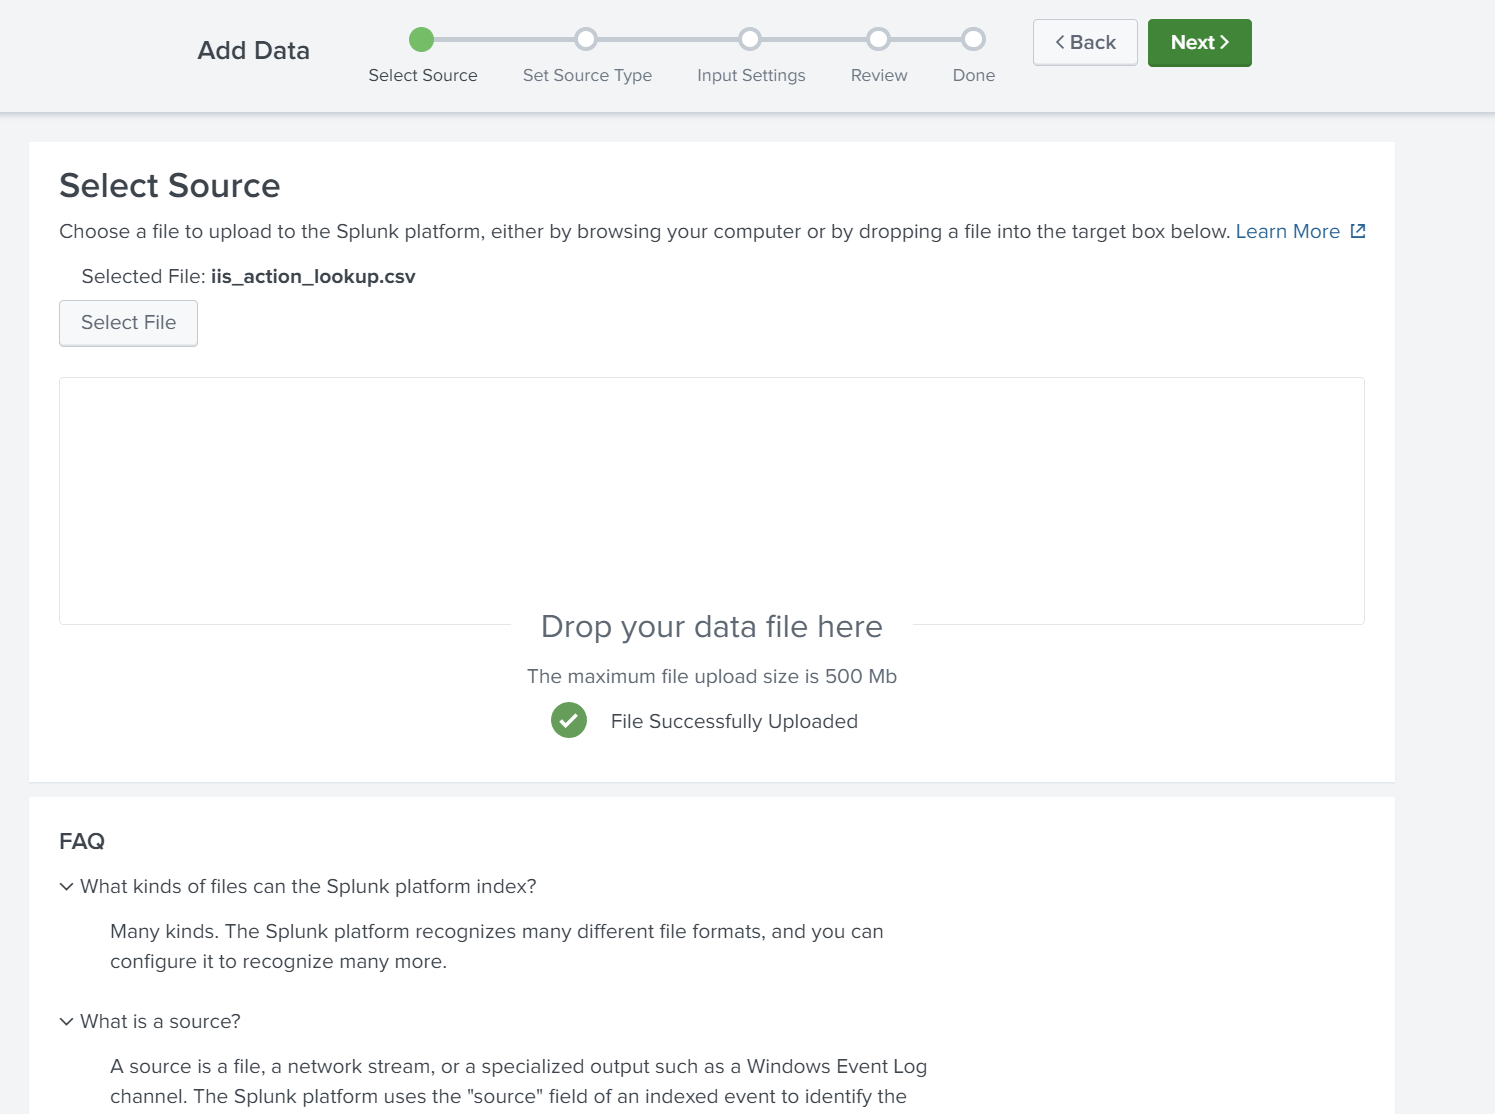
Ensure the source type is csv.
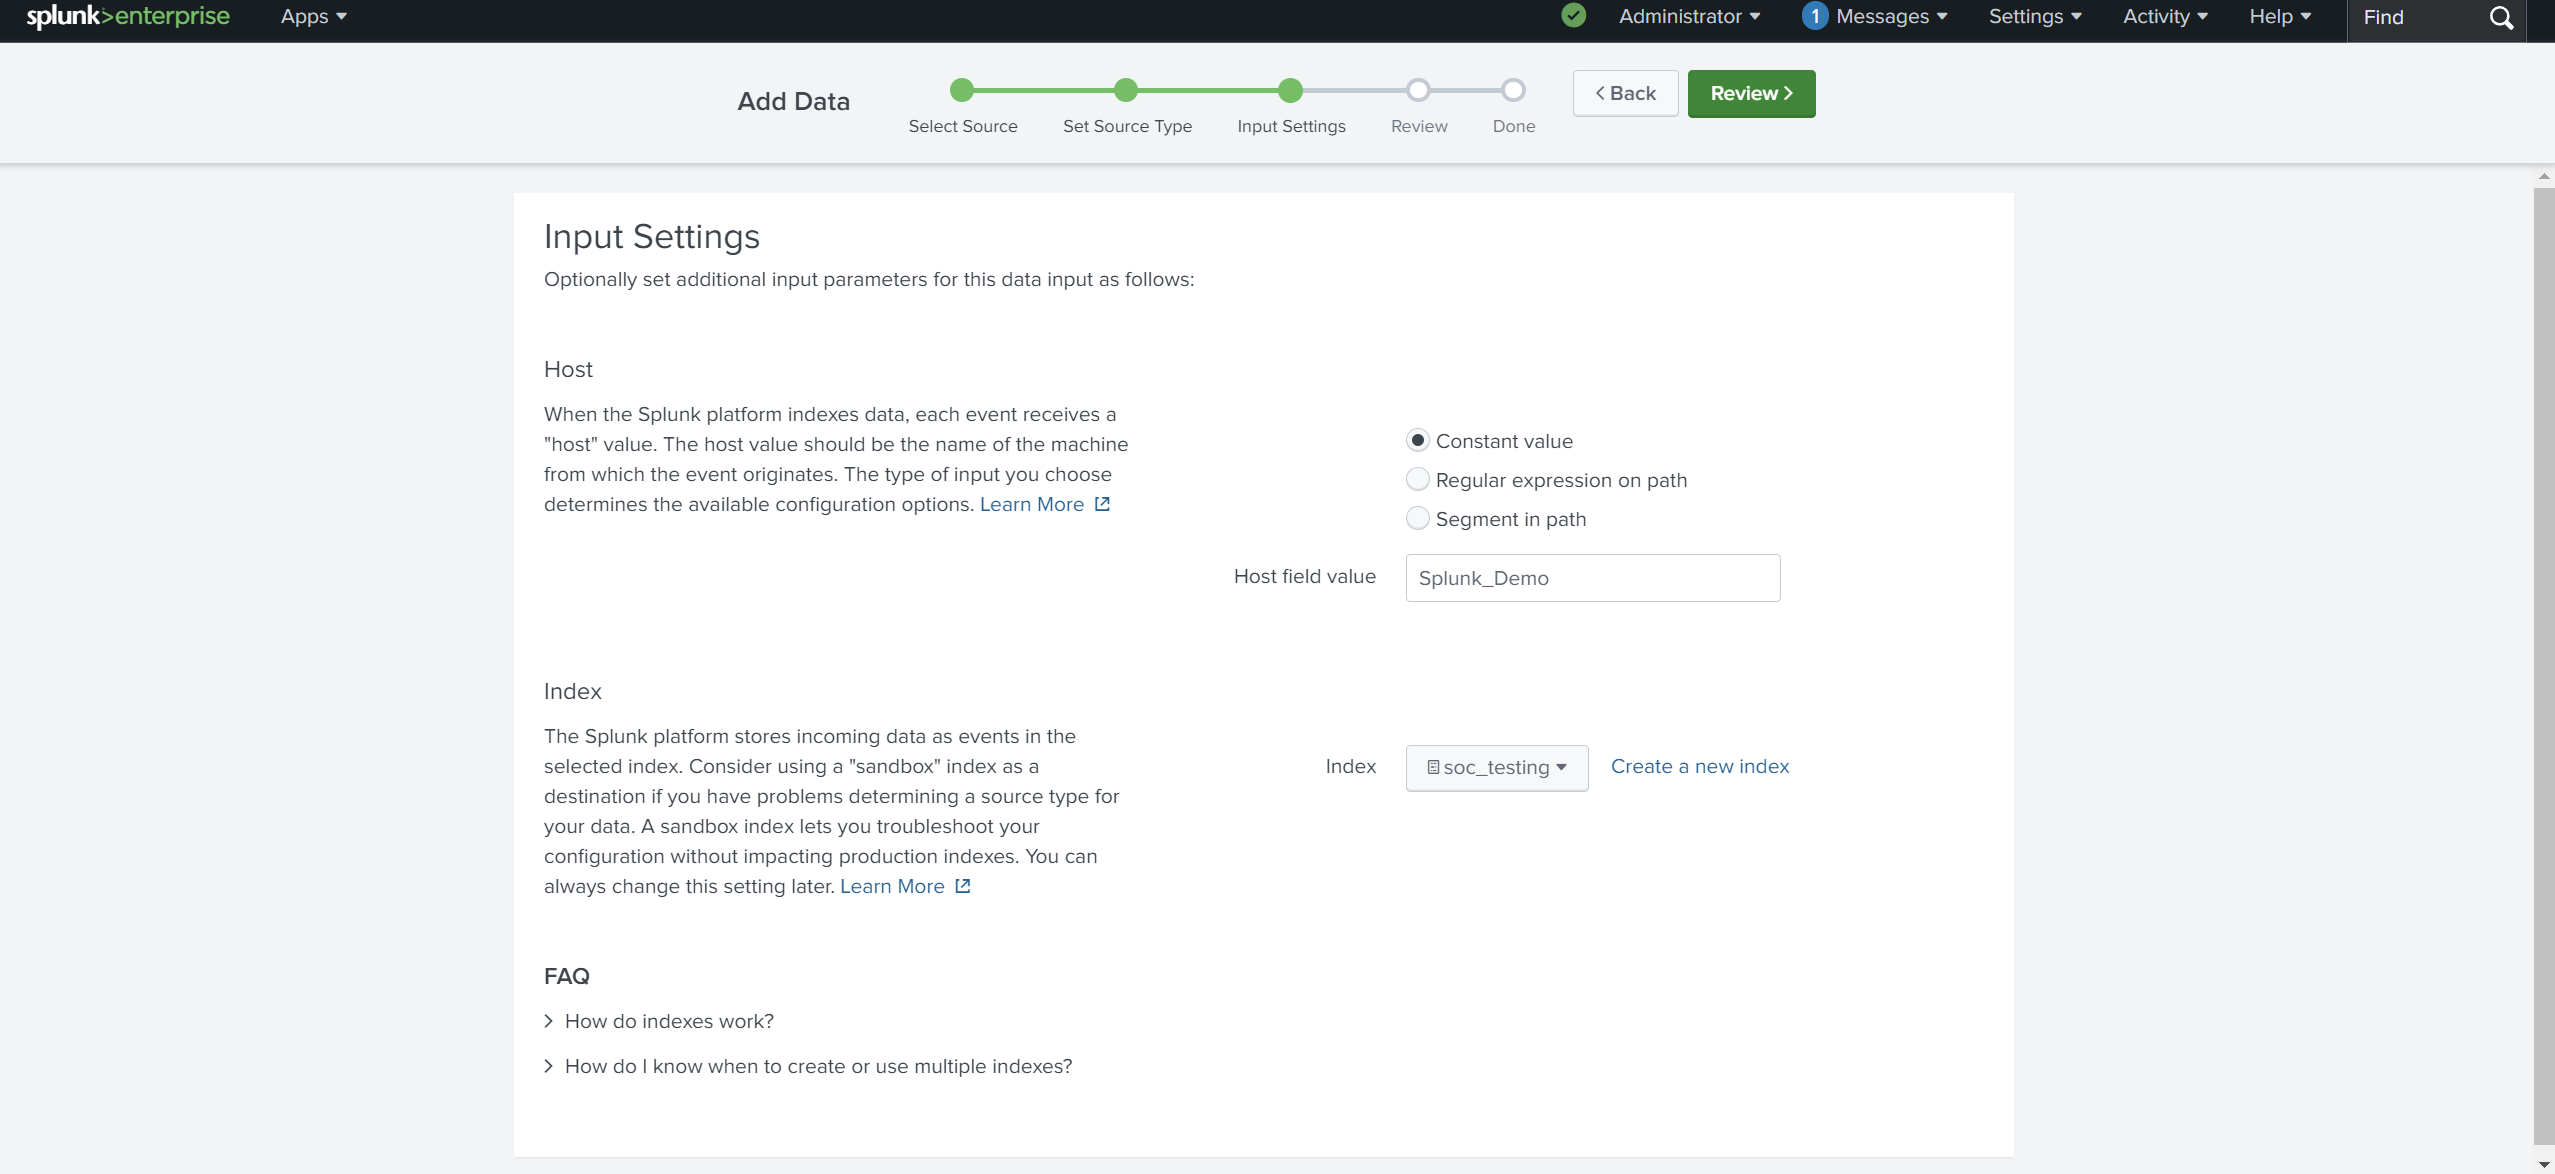
Edit Host field value and select the index where these logs will be dumped and hostName to be associated with the logs.
Note: you can create your own index.
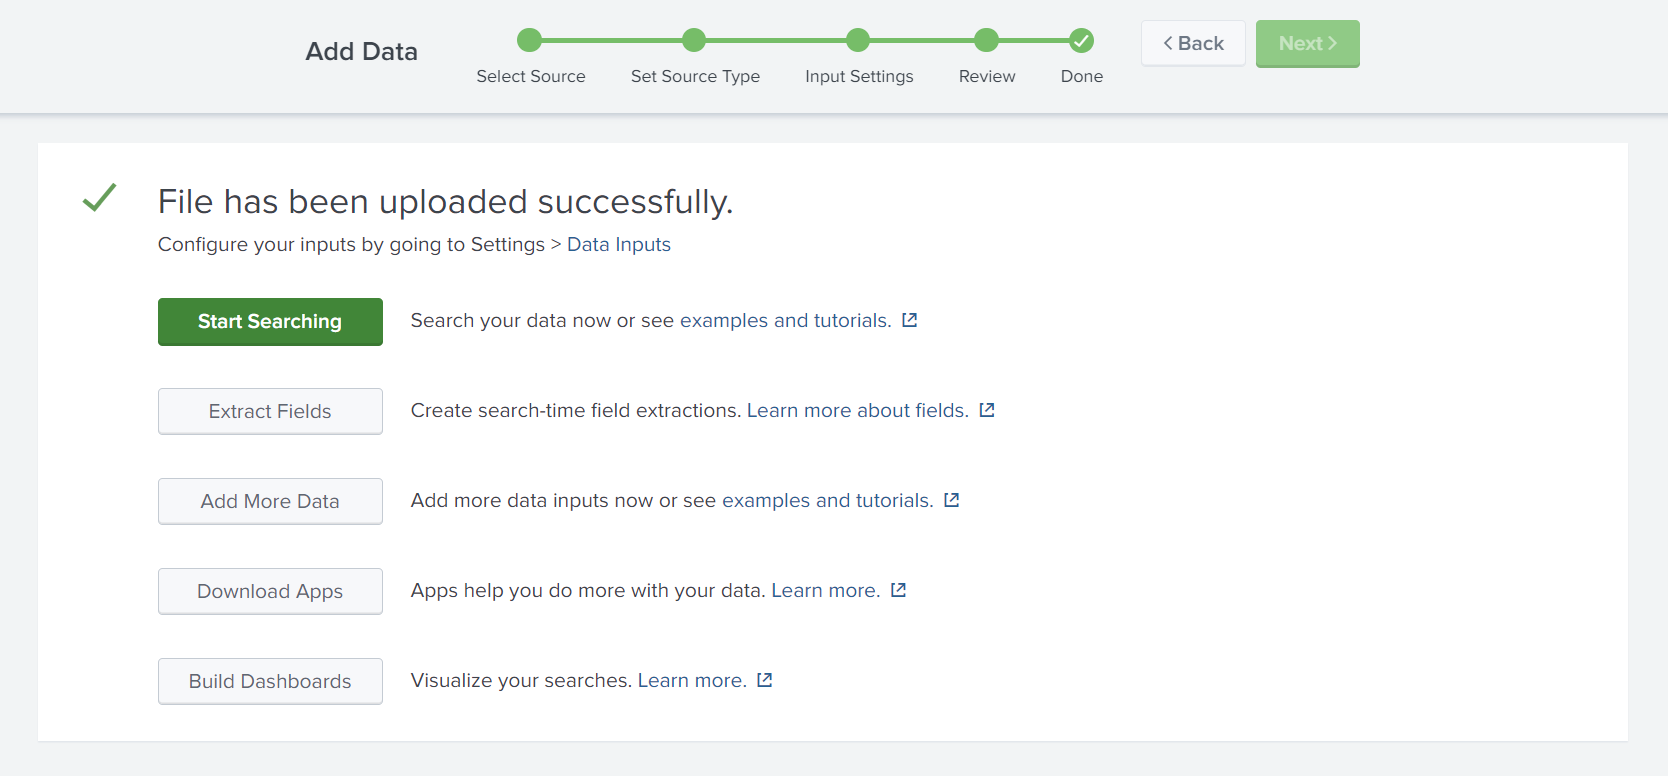
Now start searching for logs.
Splunk Demo
Let’s put everything together and practice with a demo.
For today’s demo, we will install botsv3. Follow the installation process and start the investigation.
First, type the index to access all logs under botsv3.
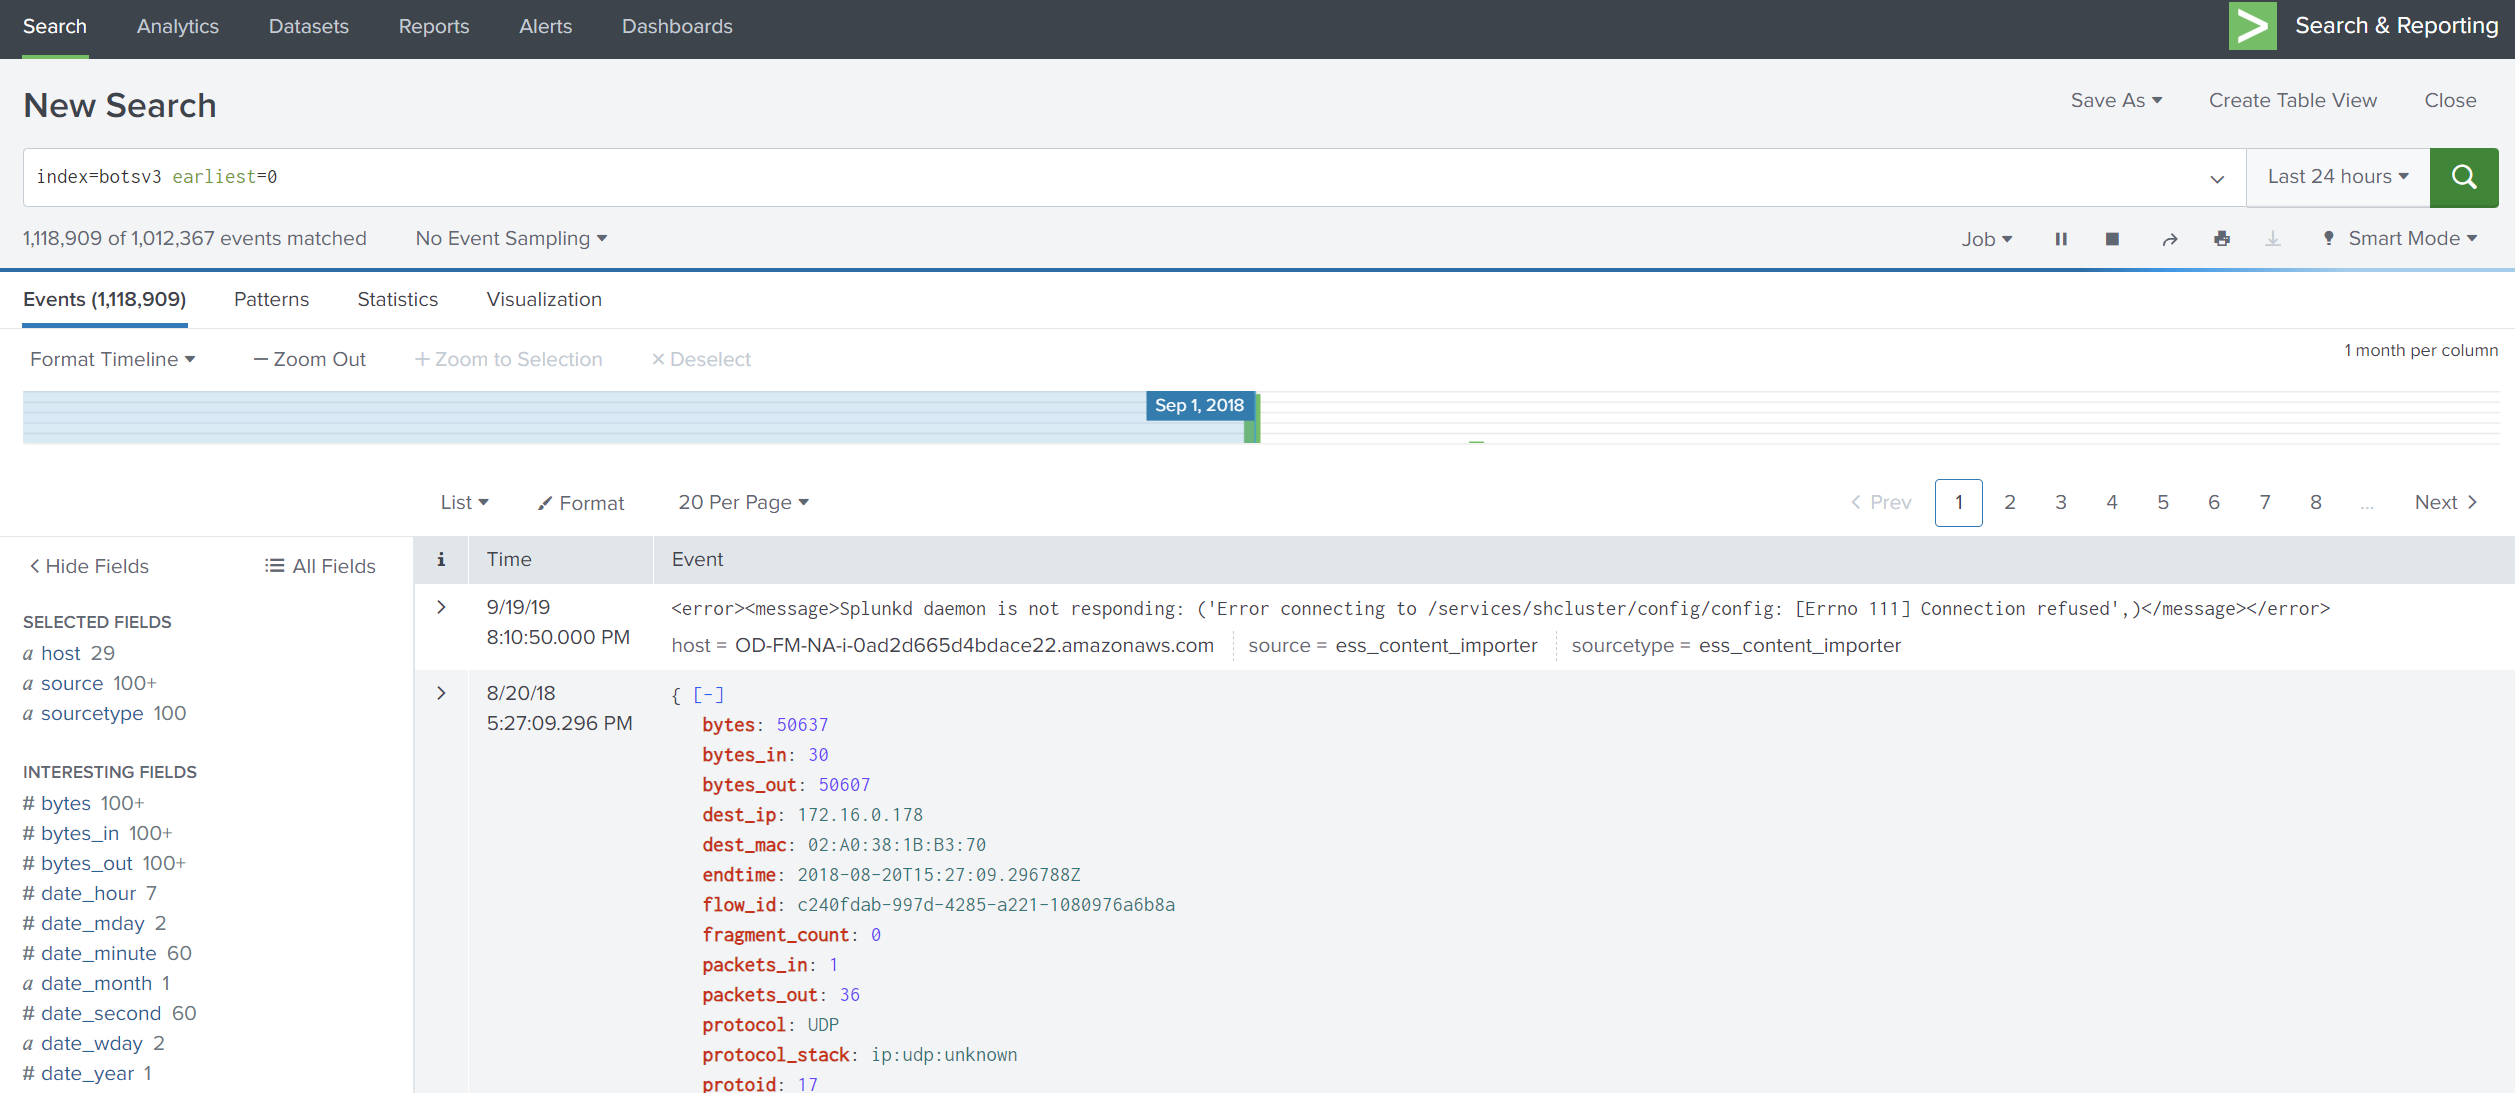
Then, look at sourcetype and select stream:ip as an example for our investigation.
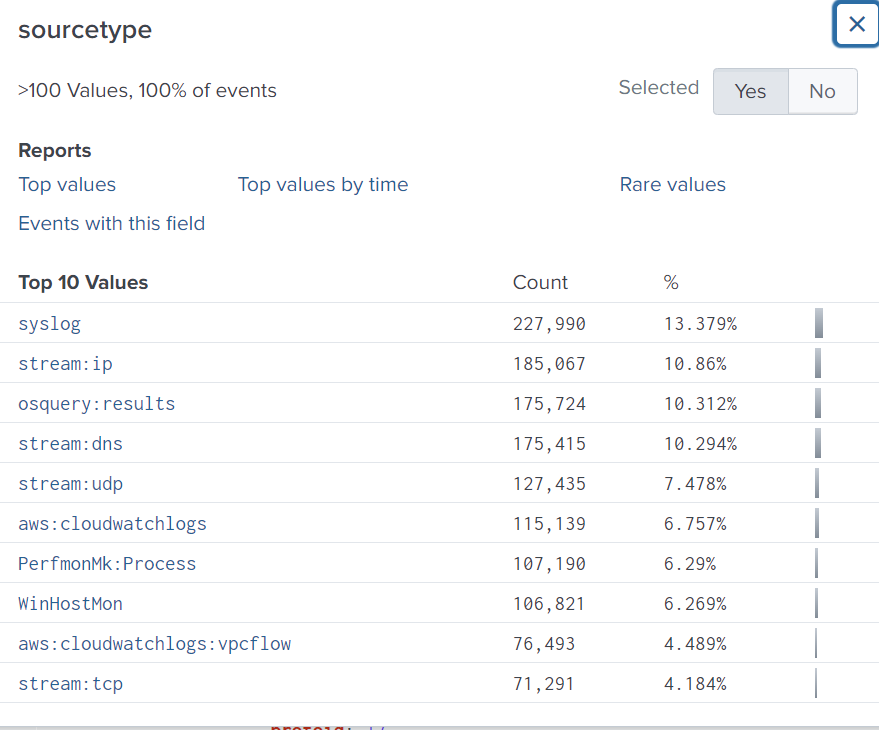
We can see on the left side a lot of fields, which provide an overview of what we are searching for.
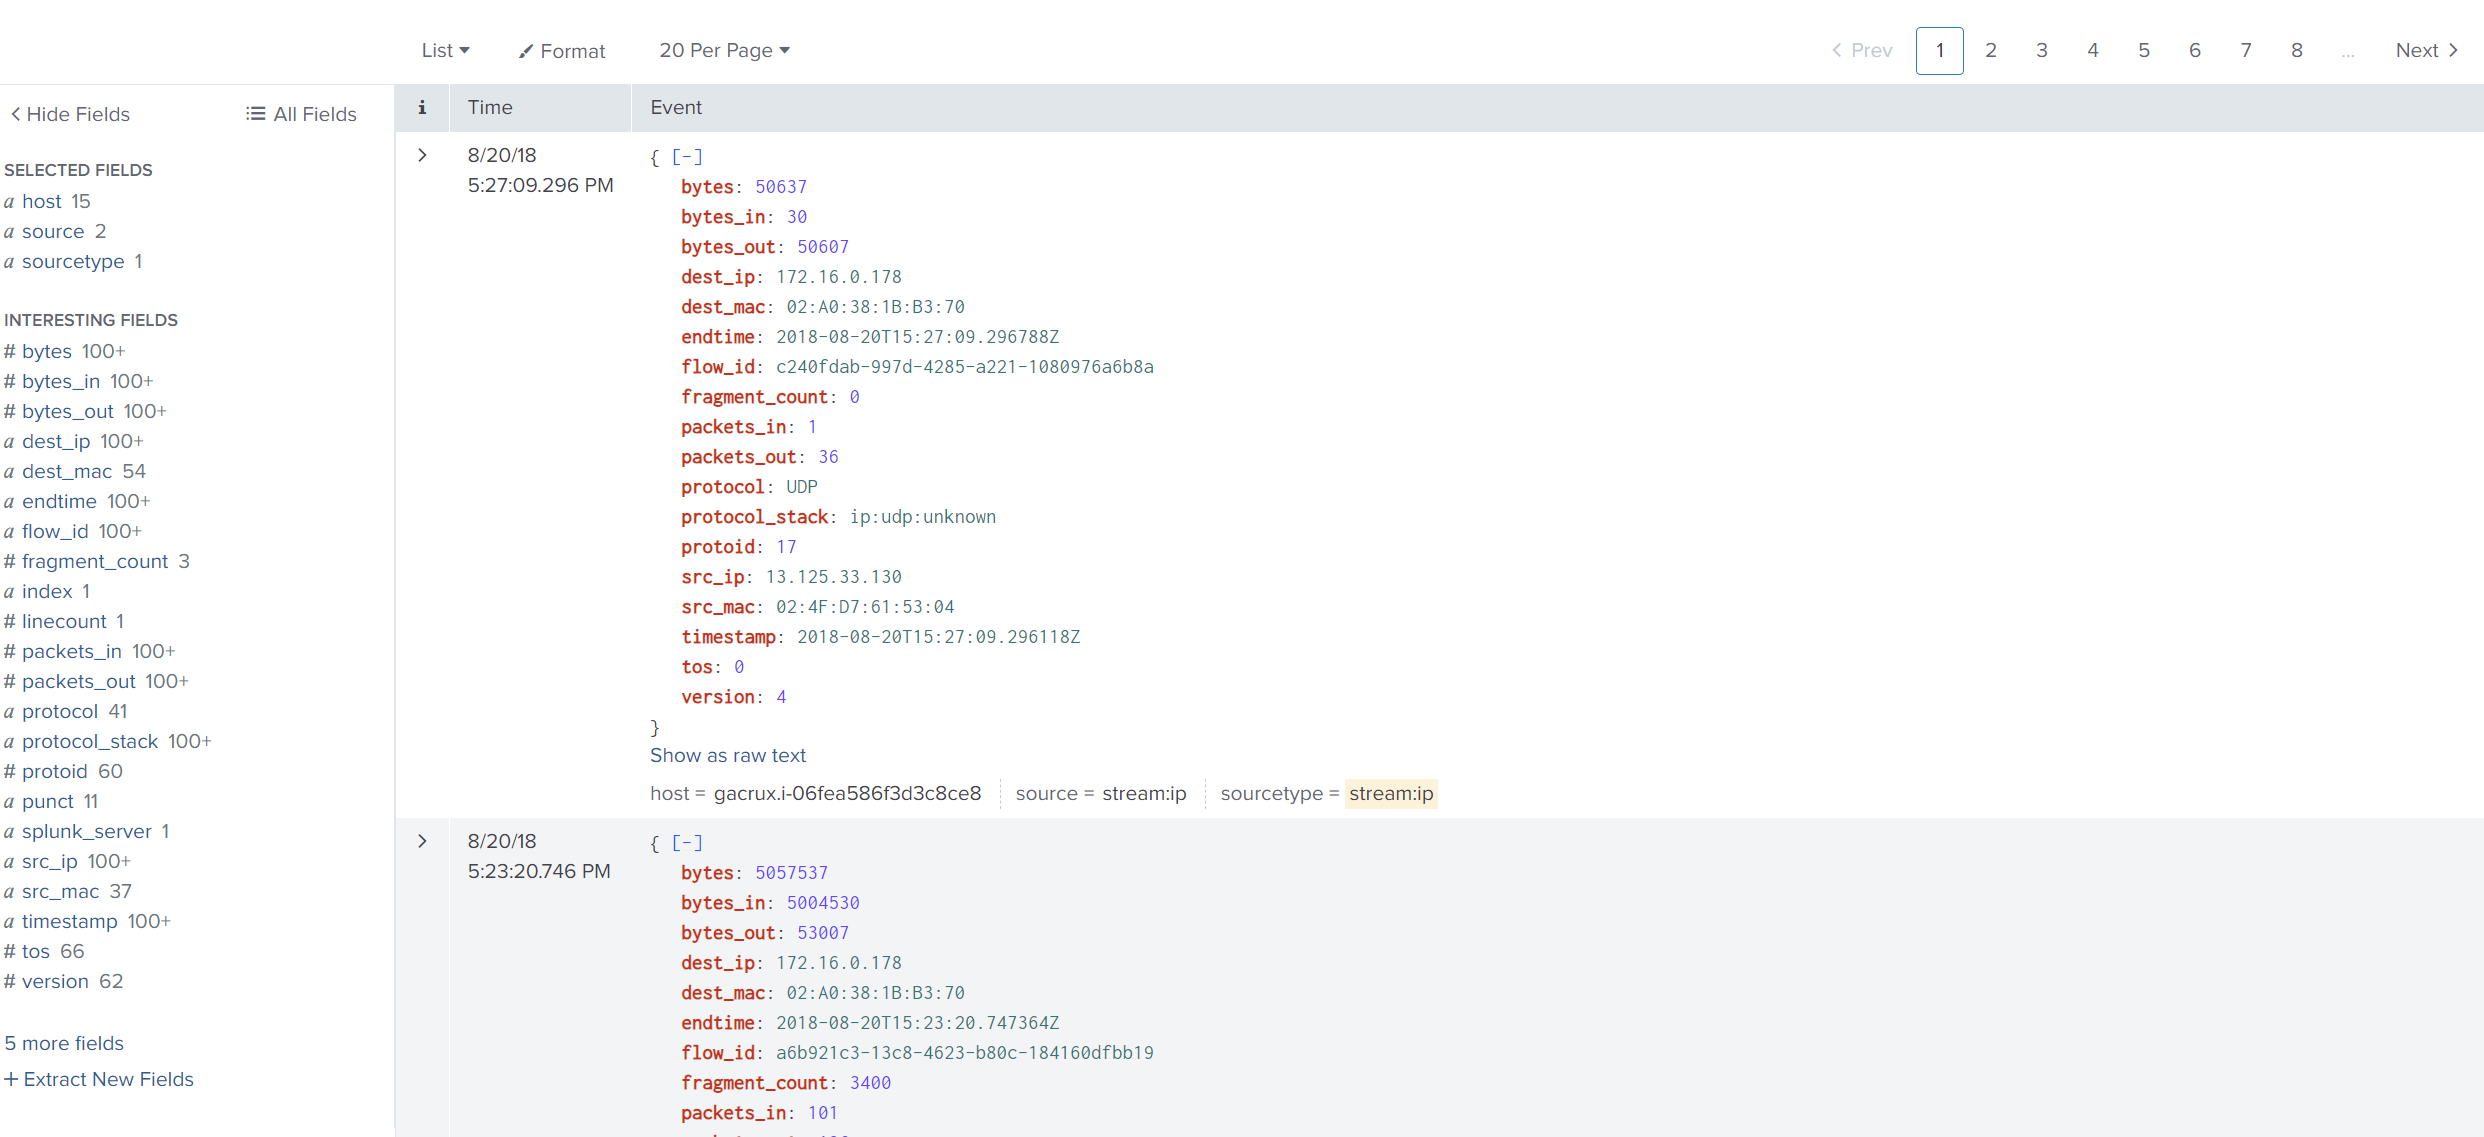
So, let’s get the _time, dest_ip, dest_mac, src_ip, src_mac, and count fields, as these fields give us an idea of who is accessing this device.
Now we will use SPL to search for these queries. We can use table to return data in a tabular format.
(src_mac=* AND dest_mac=*) filters the events to only include those where both src_mac and dest_mac fields are present.
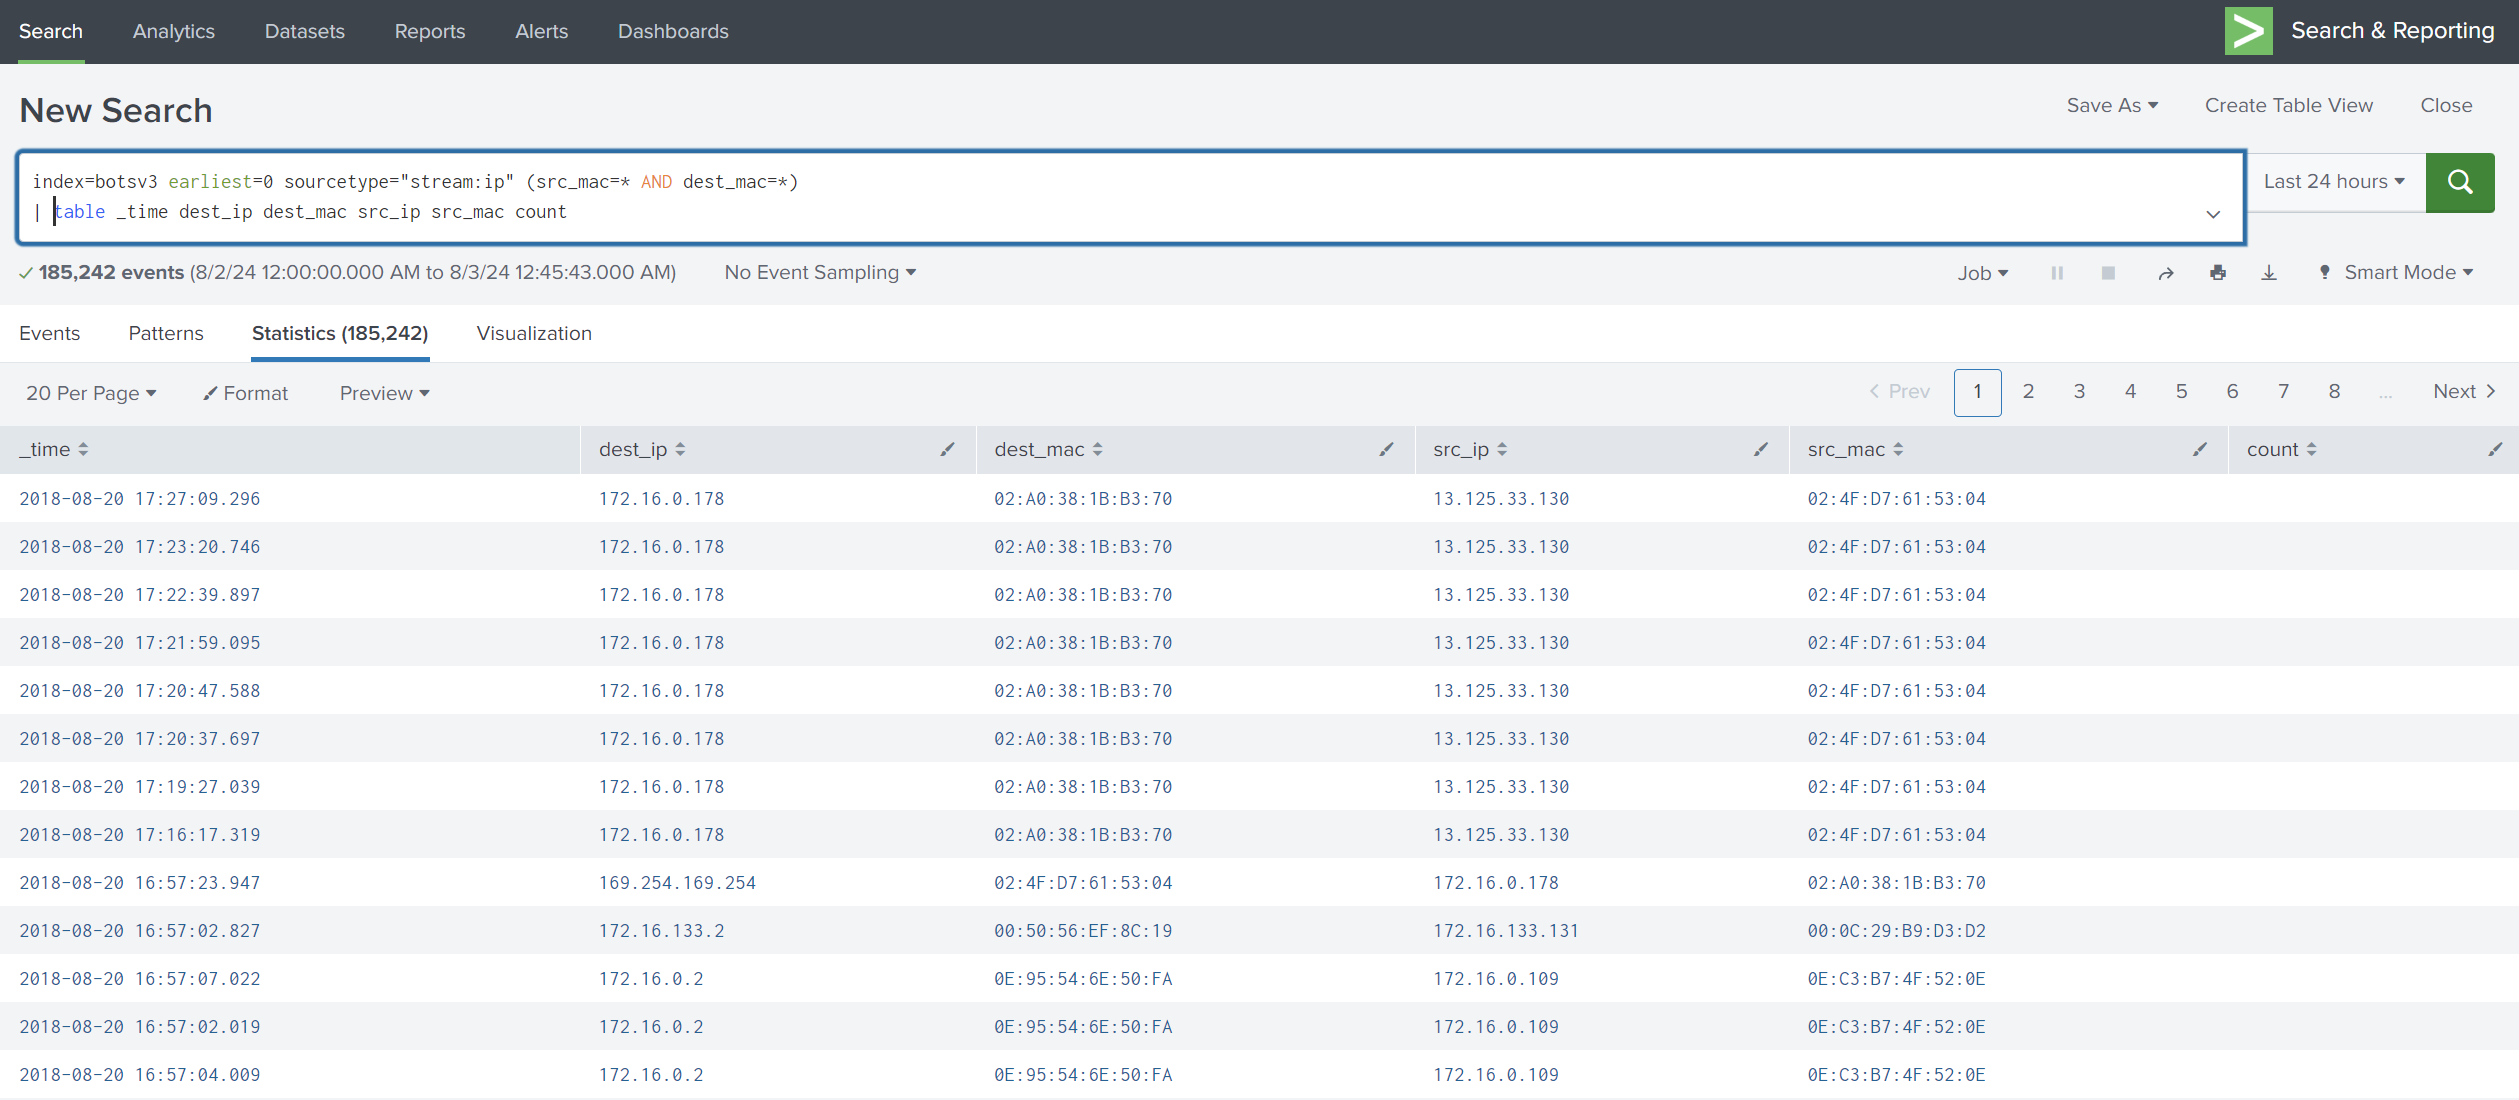
We can see above there are duplicated IPs in src_ip, which might be suspicious, so let’s see how many times those IPs appeared.
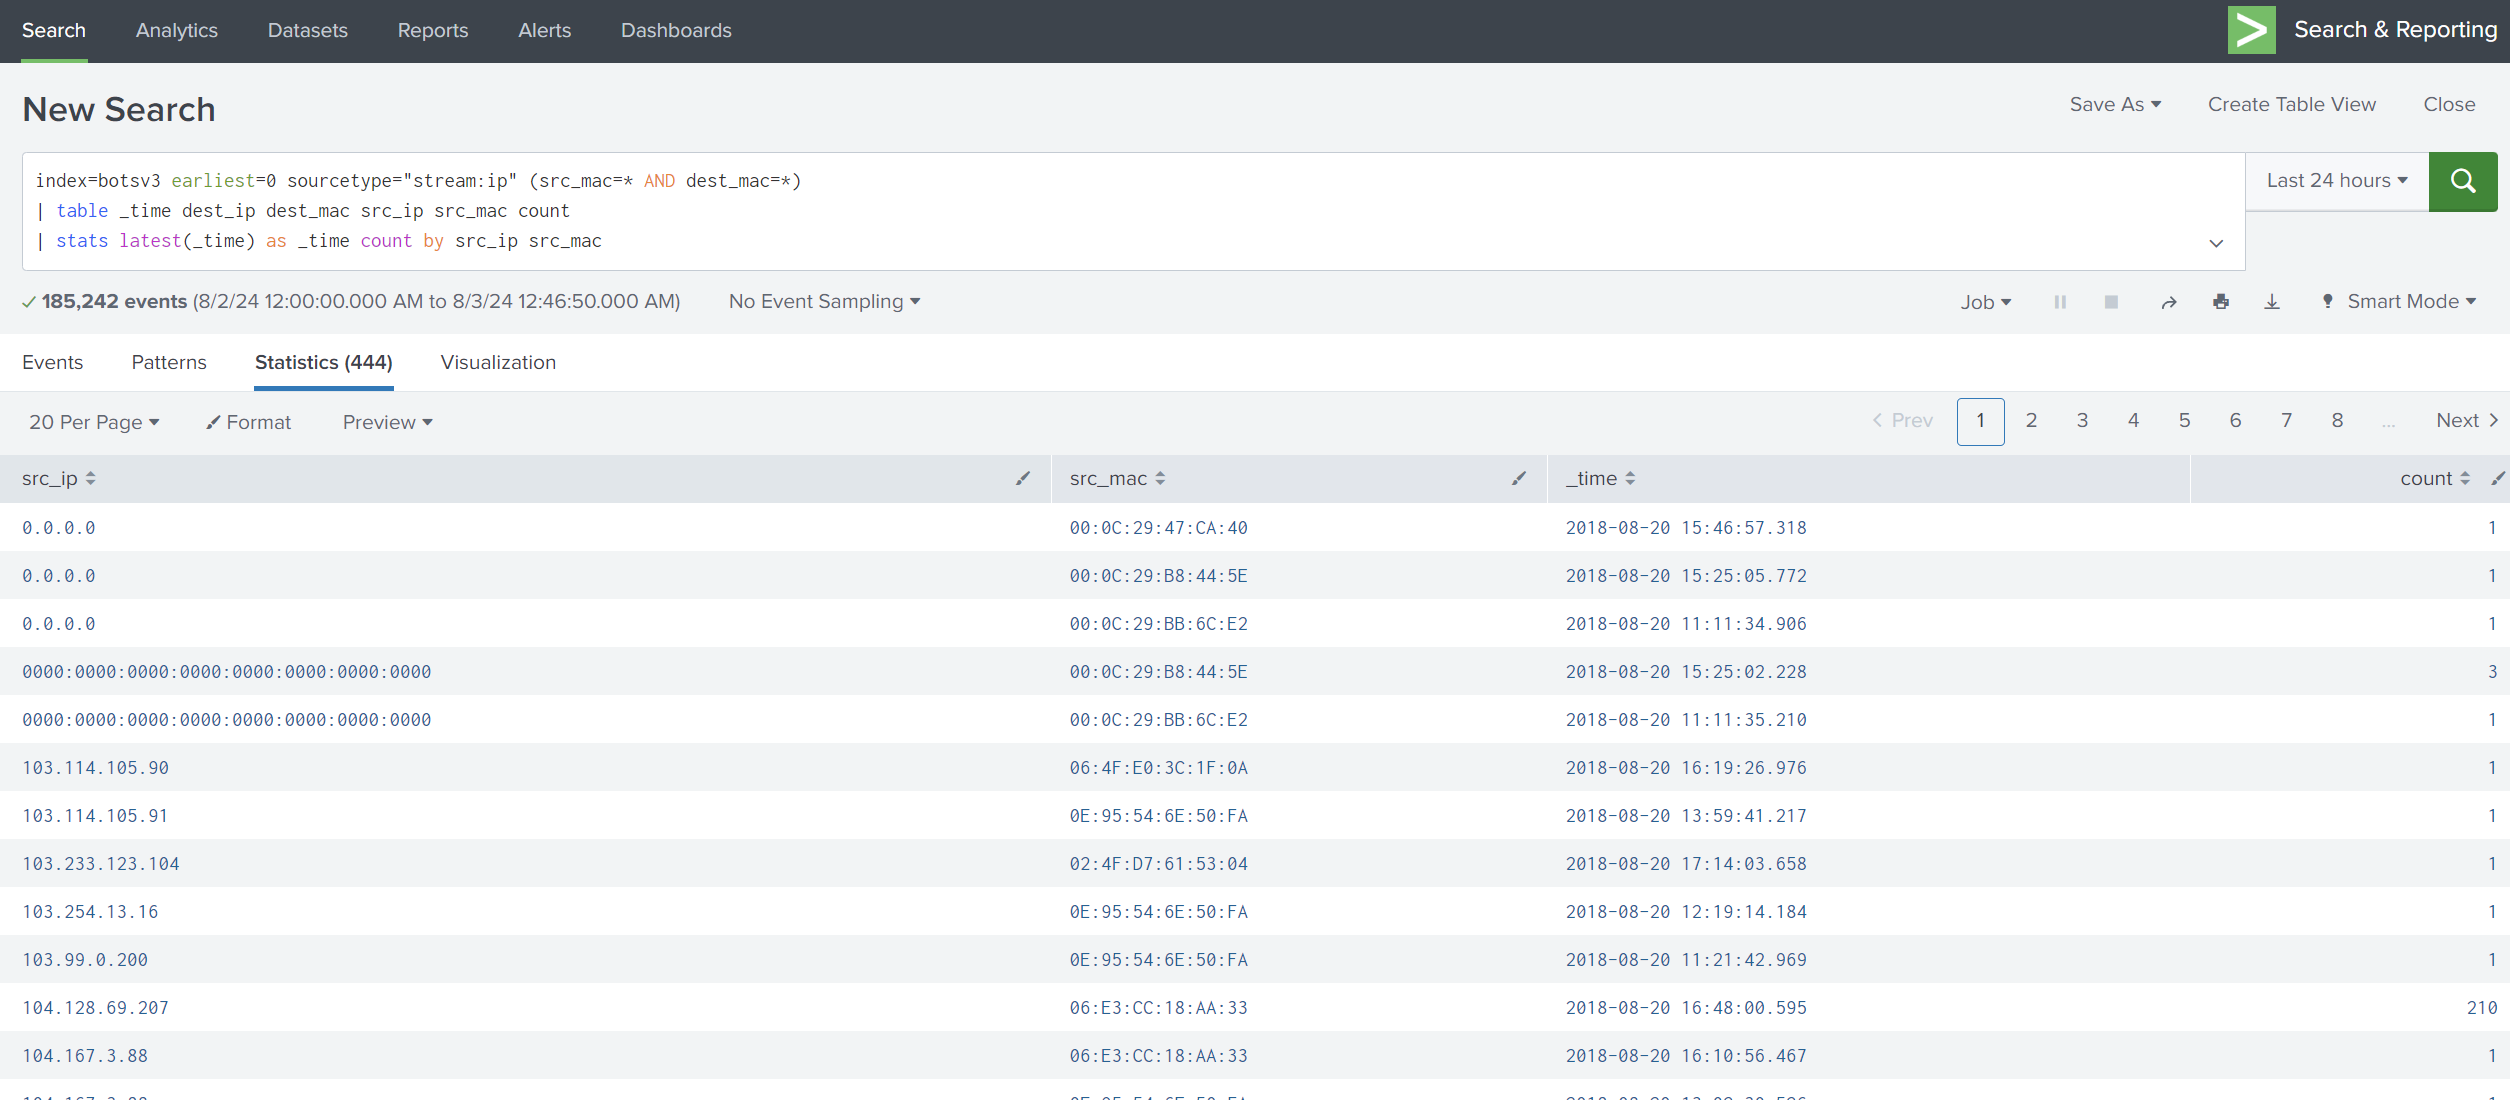
We will use stats latest(_time) as _time count by src_ip src_mac.
stats aggregates data based on the specified fields.
latest(_time) as _time finds the latest _time for each combination of src_ip and src_mac.
count by src_ip src_mac counts the number of events for each combination of src_ip and src_mac.
Let’s sort them according to their count and display the country of each IP address.
The final search query:
index=botsv3 earliest=0 sourcetype="stream:ip" (src_mac=* AND dest_mac=*)
| stats latest(_time) as _time count by src_ip src_mac
| table _time dest_ip dest_mac src_ip src_mac count
| iplocation src_ip
| sort - count
| search Country=*
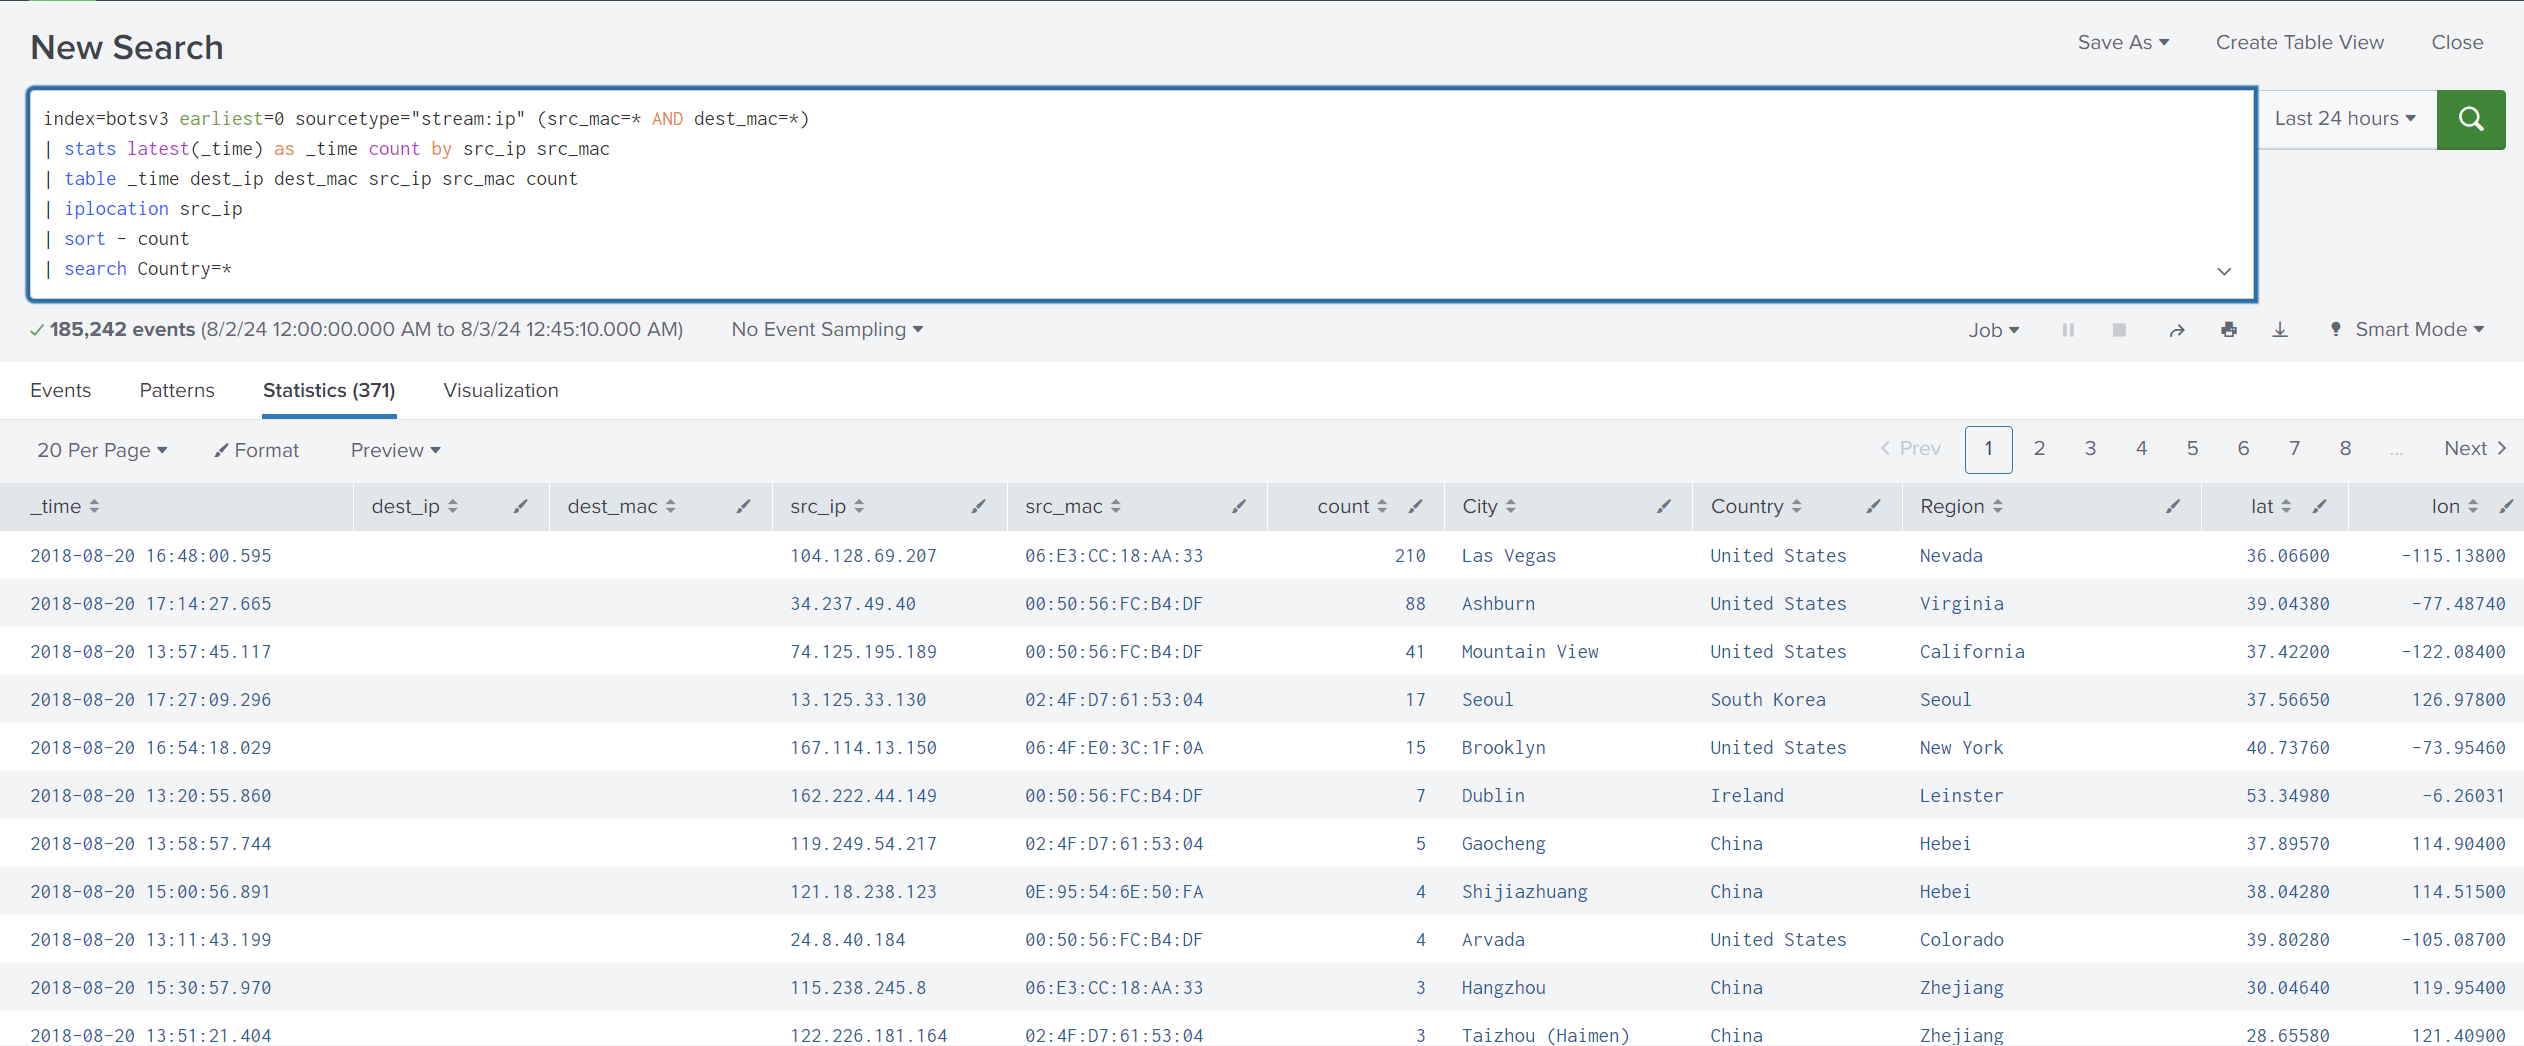
We can see above that the IP 104.128.69.207 has a high count compared to the rest of the IPs, which is very suspicious.
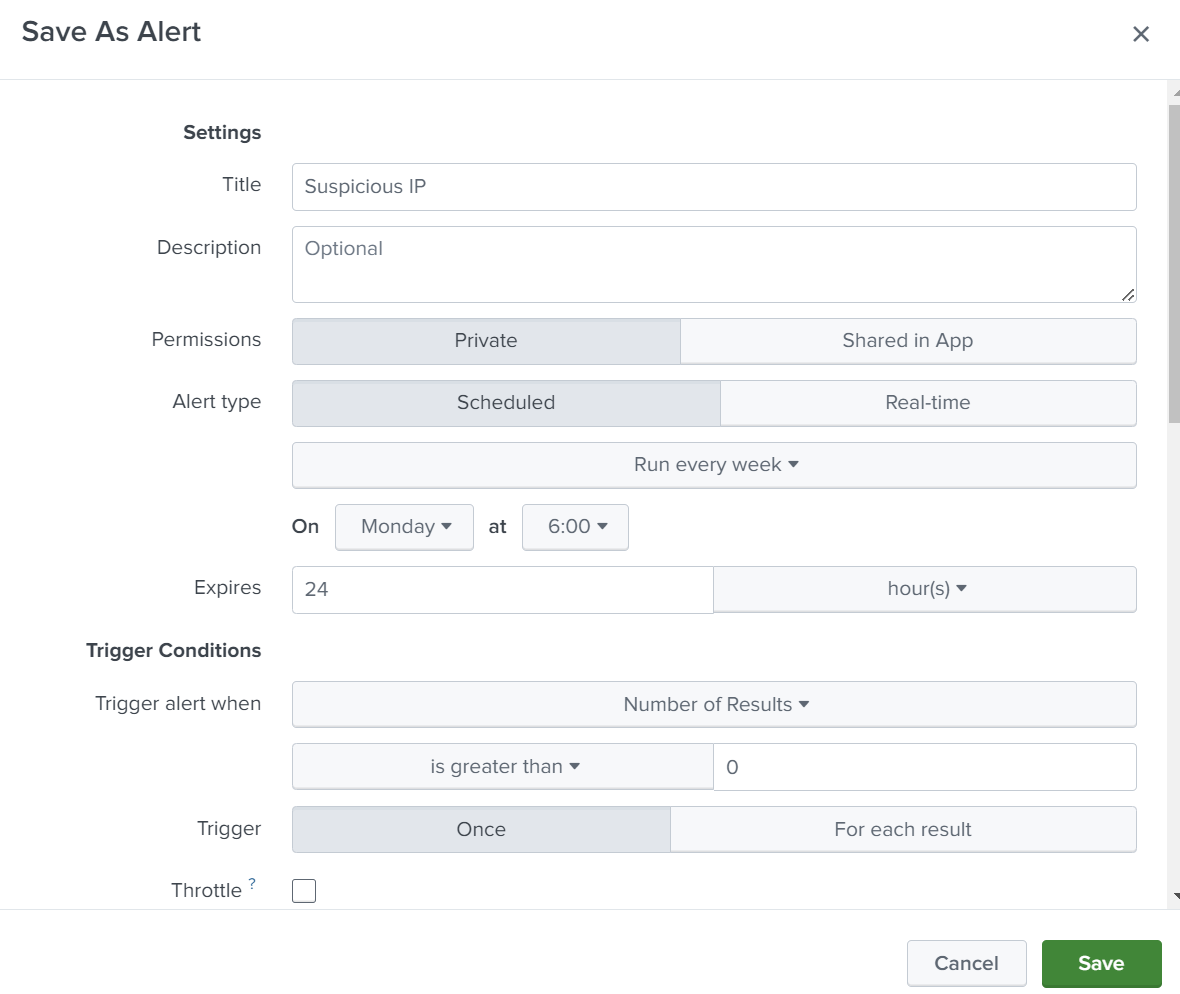
So we can create an alert for a particular search. Let’s say that if the count is greater than 100, this is considered suspicious activity.
We will add search count > 100 and click on Save As, then choose

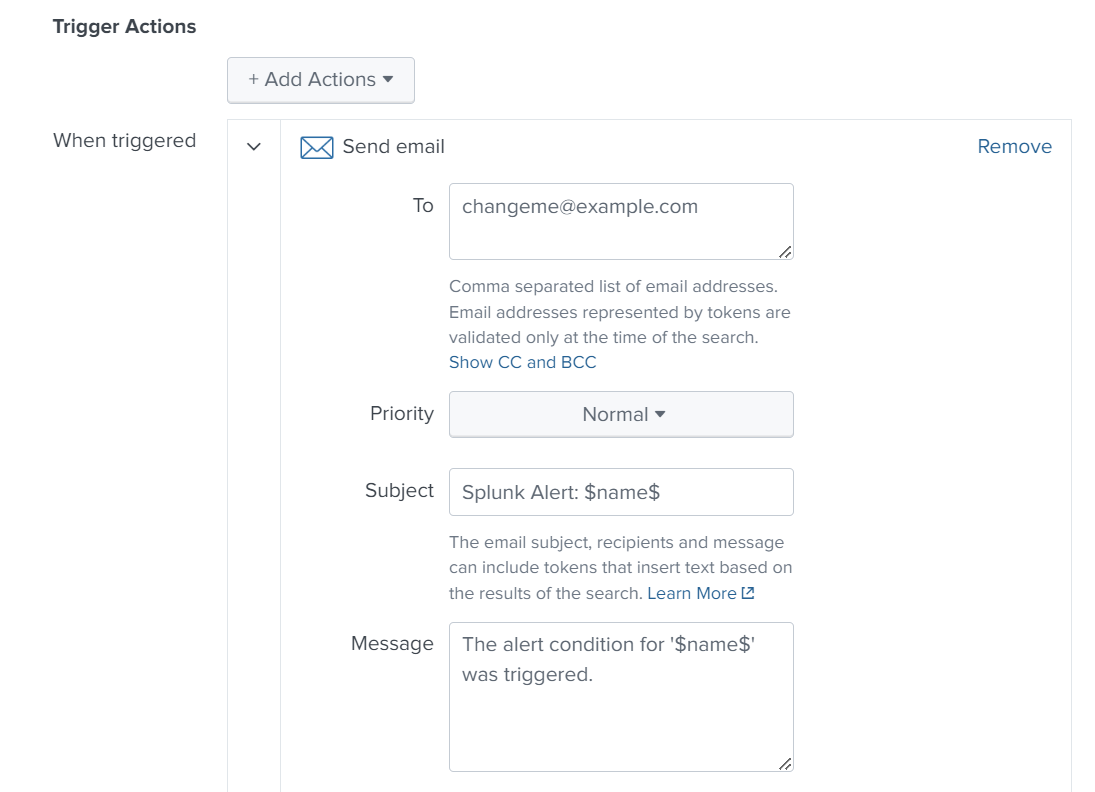
We can type a title for the alert and specify what action should be taken.
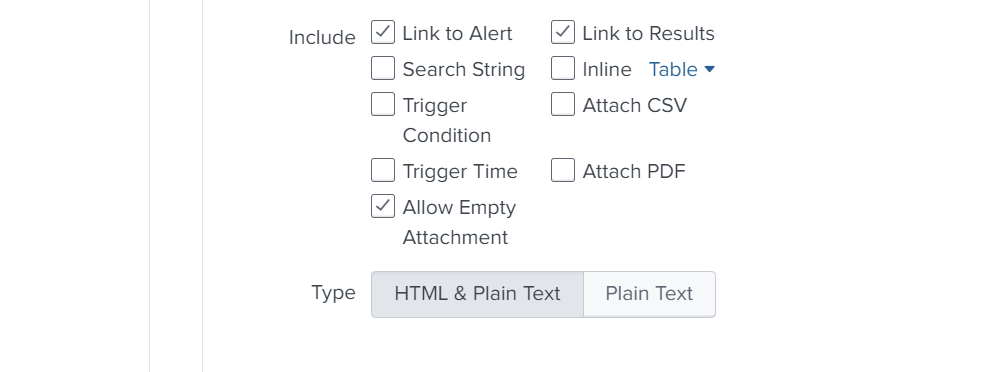
We set up an email as an action. If the alert is triggered, an email will be sent to the analyst with a message, so they can take action and block this IP.
By now, we have learned how to install Splunk, forward logs, search logs, create dashboards, and create alerts.
In the final part, we will connect forwarders from different machines, perform an attack, and monitor logs using Splunk.
Thanks for reading.