SIEM Tutorial - Part 3

Hello, in Part 2, we covered what Splunk is, its components, explored its interface, and solve a small piece of the botsv3 dataset. Today, we are going to dive into another functionality in Splunk.
In this part, we will learn how to forward data from different machines to Splunk for analysis.
Table of Contents
- Lab Setup
- Installing Splunk Universal Forwarder
- Configuring Splunk to Receive Data
- Configuring Linux Splunk Forwarder
- Viewing Logs in Splunk Enterprise
- Attacker Simulation: Directory Brute-Forcing
- Creating Alerts for Suspicious Activity
- Resources
- Conclusion
Lab Setup
For this lab, we will need three virtual machines (VMs):
- VM #1: for Splunk Enterprise (Windows VM)
-
VM #2: for Splunk Forwarder (Linux VM)
- VM #3: for an attacker (Linux VM)
Note: If you don’t have a Windows VM, you can use your local host as the Splunk Enterprise machine.
Installing Splunk Universal Forwarder
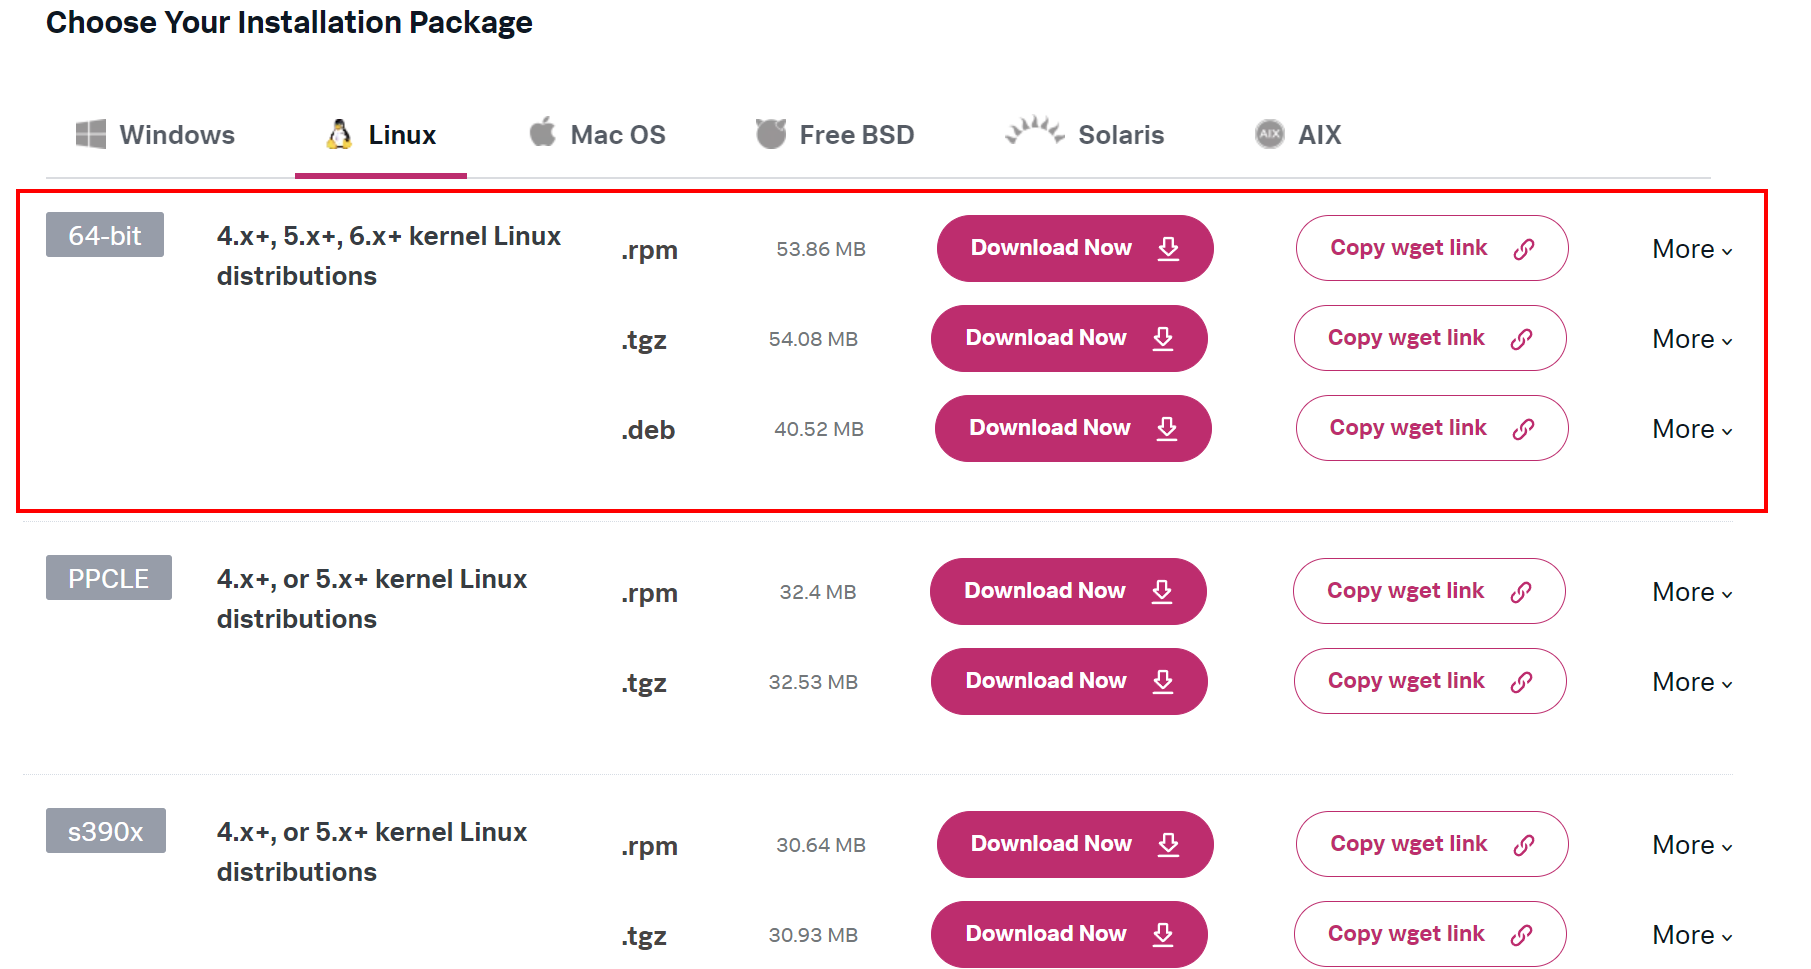
Let’s start by installing the Splunk Universal Forwarder. As we will use Linux, we need to download one of these distributions.
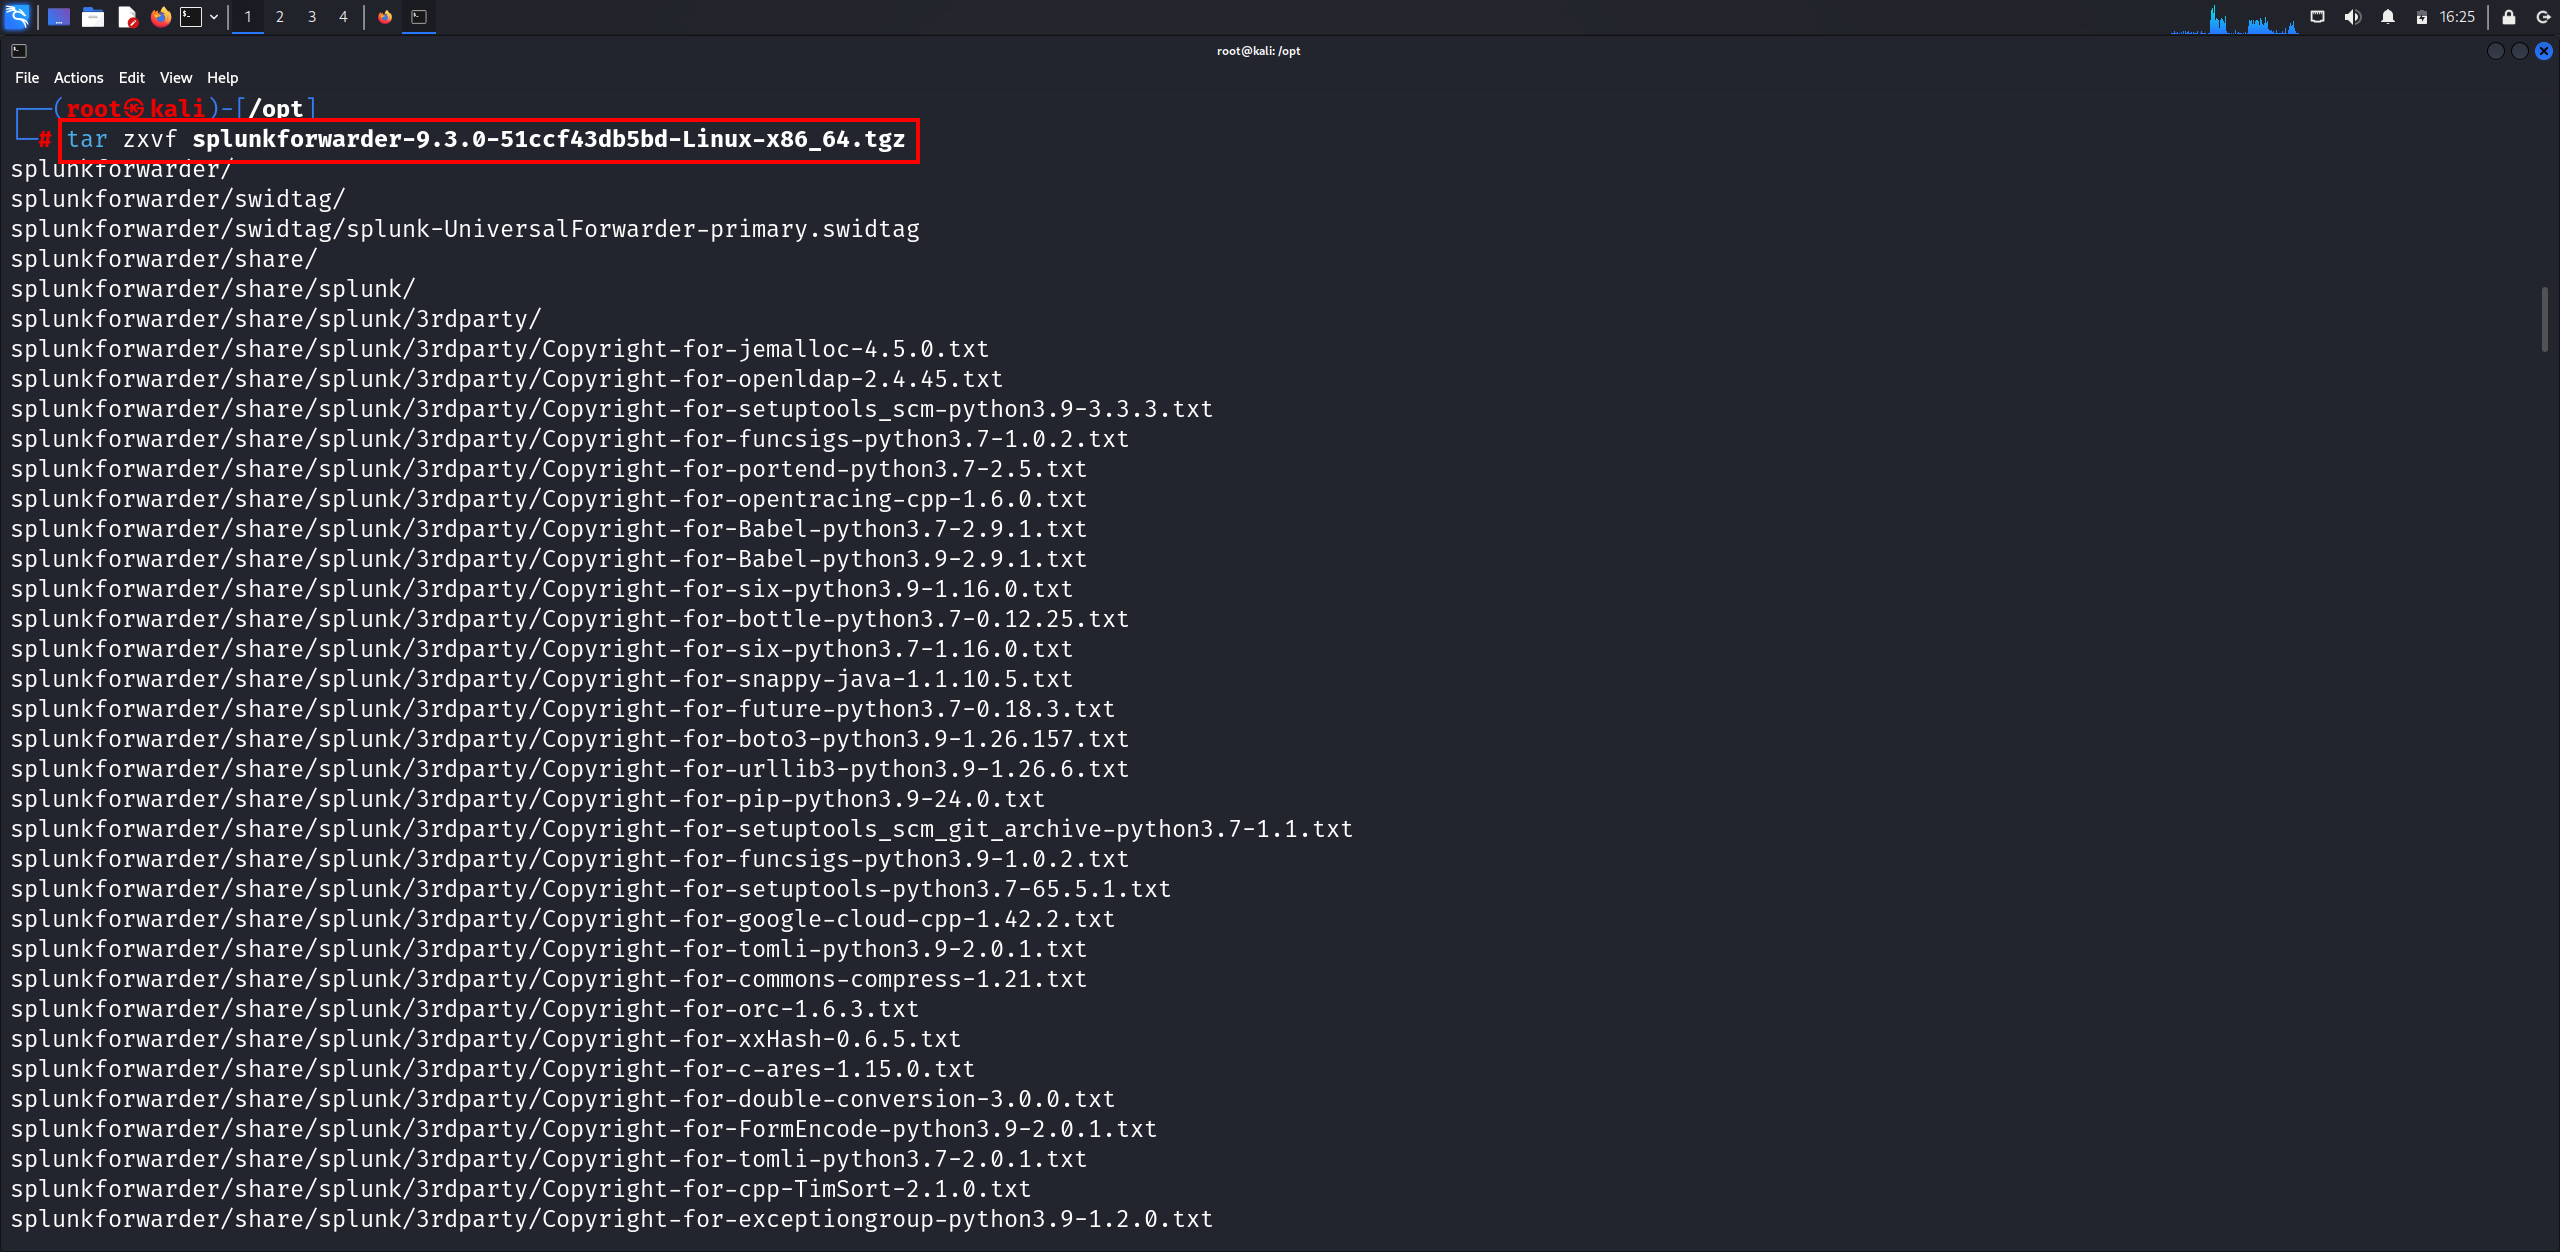
After downloading, let’s extract the files.
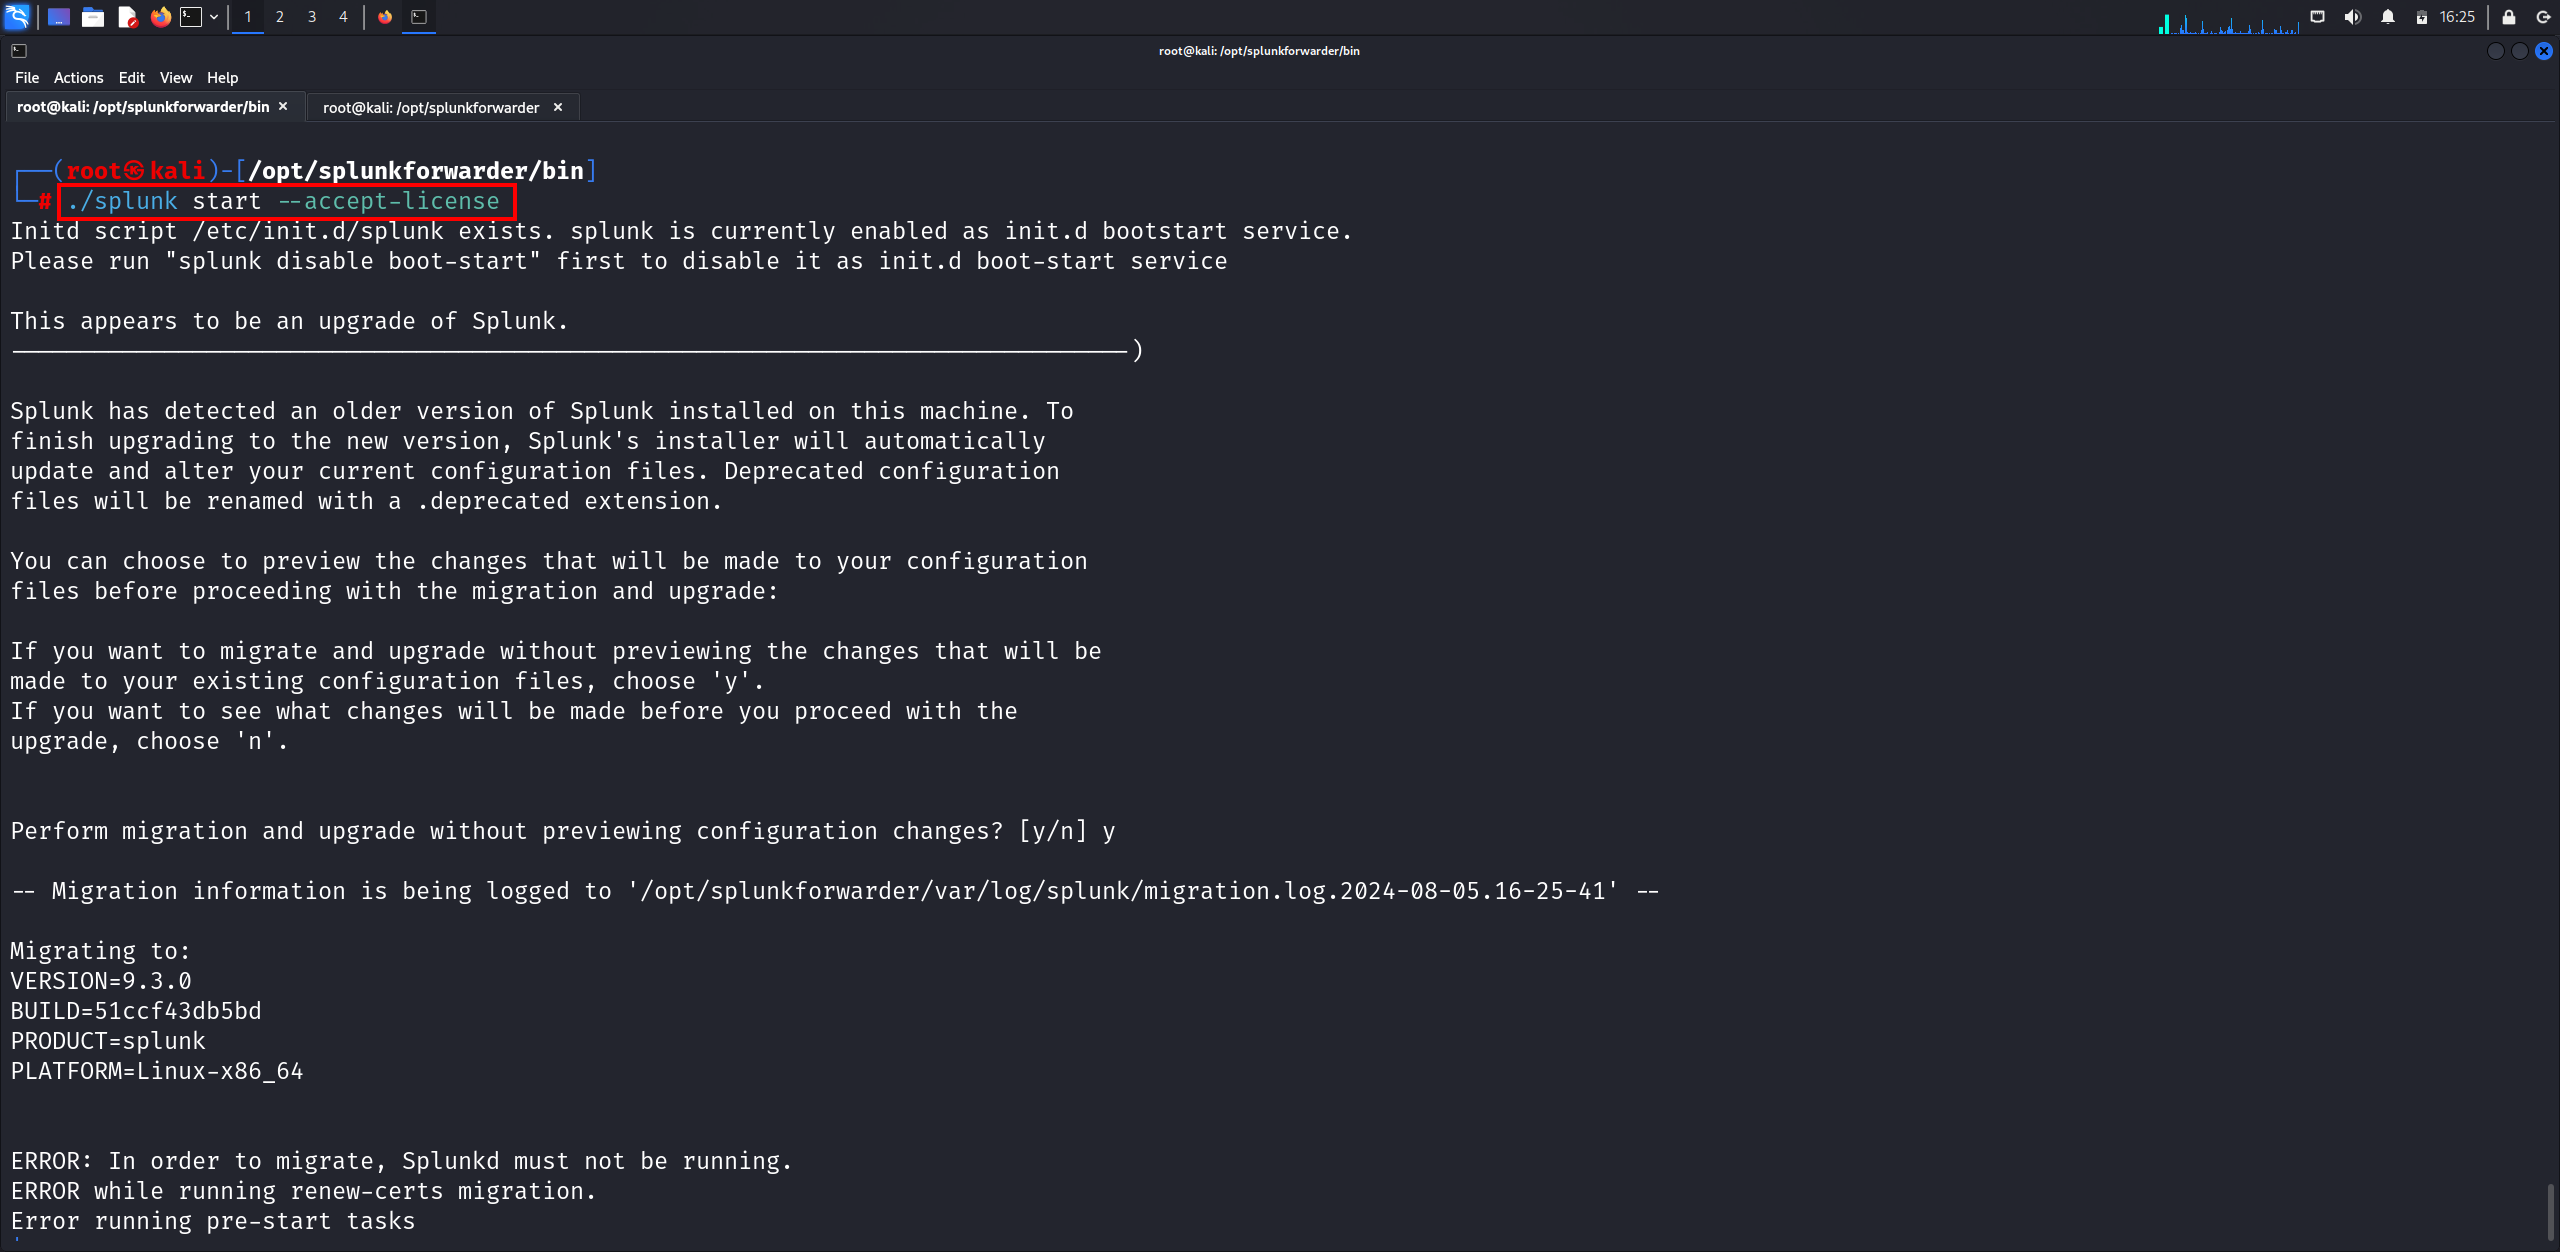
Let’s navigate to the Splunk directory and start the setup by accepting the license agreement using:
./splunk start --accept-license
Note: You need to enter the login credentials as Splunk Enterprise.
Configuring Splunk to Receive Data
Now that we’ve installed the Splunk Forwarder, we need to configure Splunk Enterprise (Windows VM) to receive data from the forwarder. Follow these steps to configure the port for receiving data:
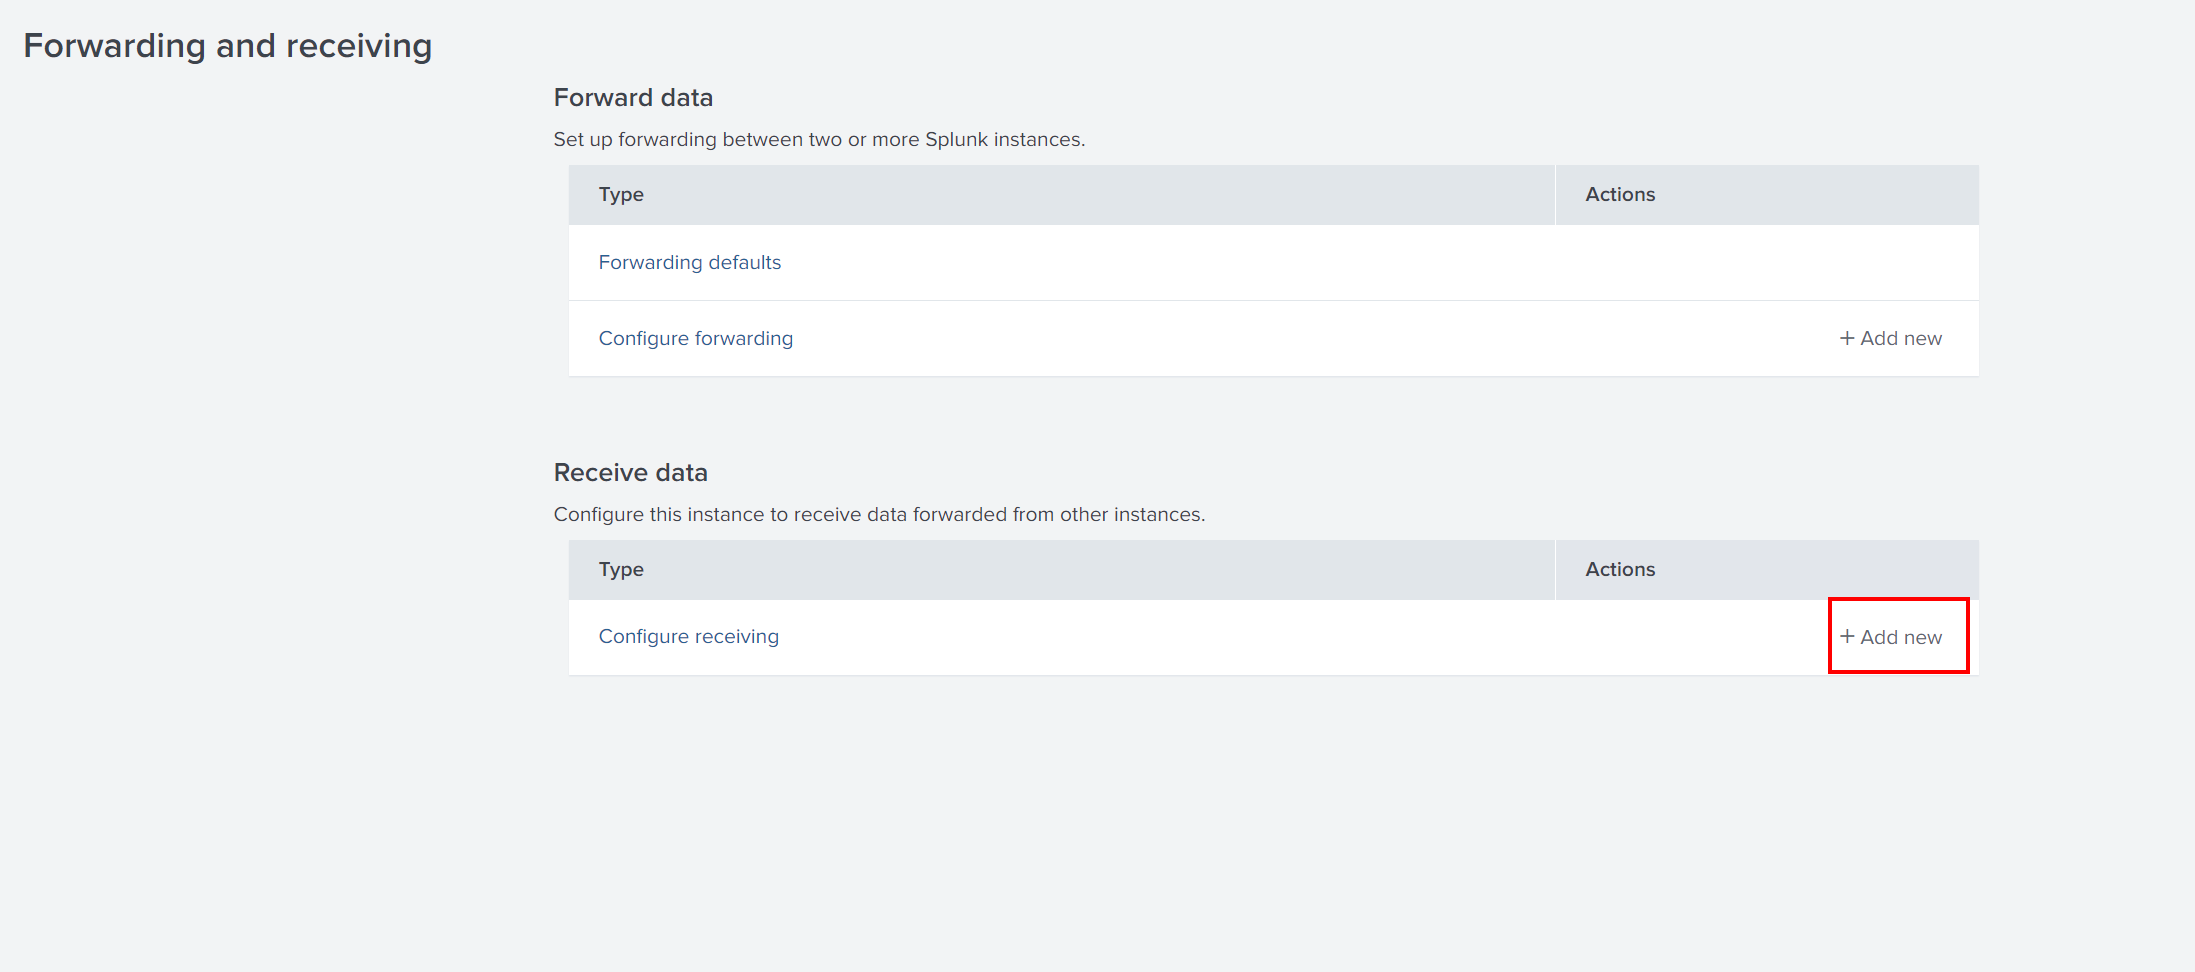
- Go to Settings -> Forwarding and Receiving.
- Click on Add new under New Receiving Port.
- Set the receiving port to
9997(or any other port) and click Save.
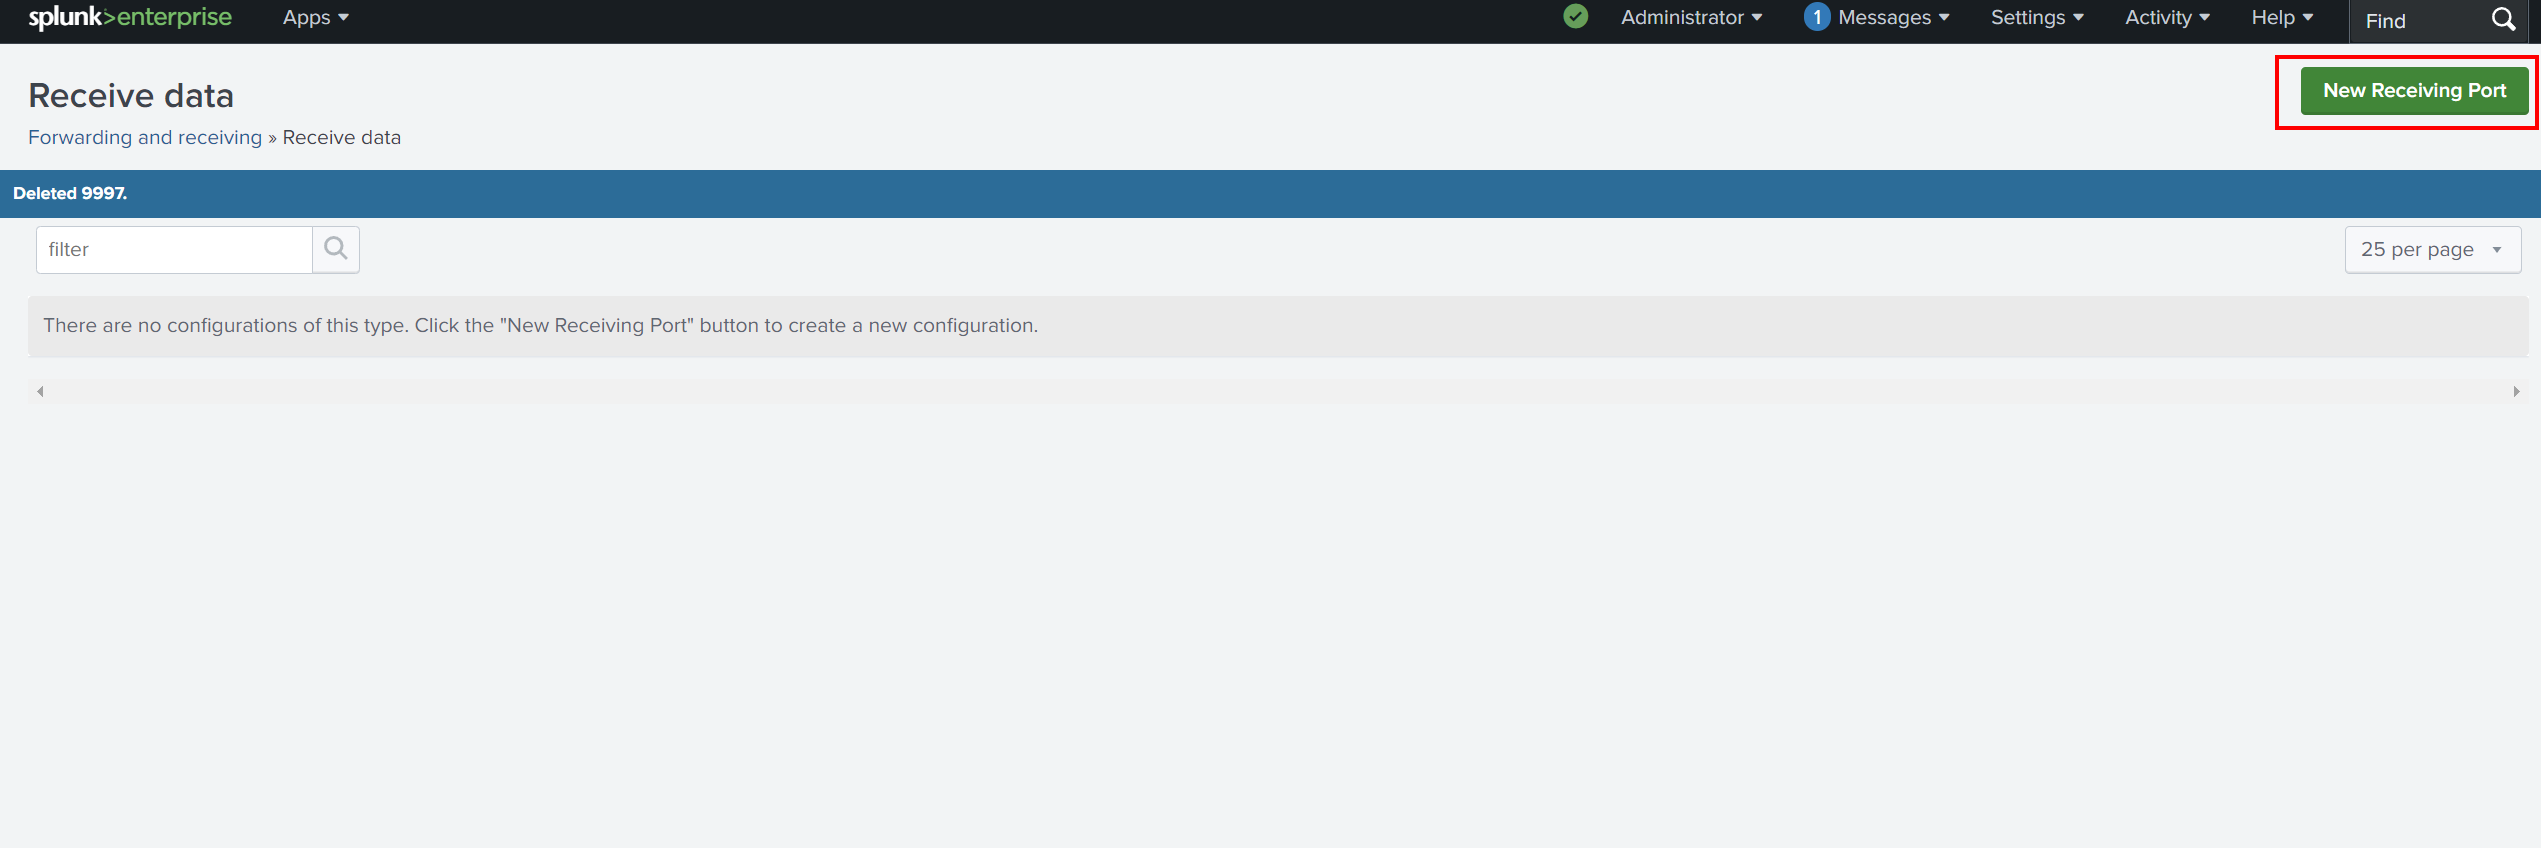

Port
9997is the default for receiving forwarded data, but it can be configured differently.
Next, we need to create an index to store the logs coming from the Linux forwarder. To do this:
- Go to Settings -> Indexes.
- Click New Index and name it something like
kali_logs. - Set the options and save.
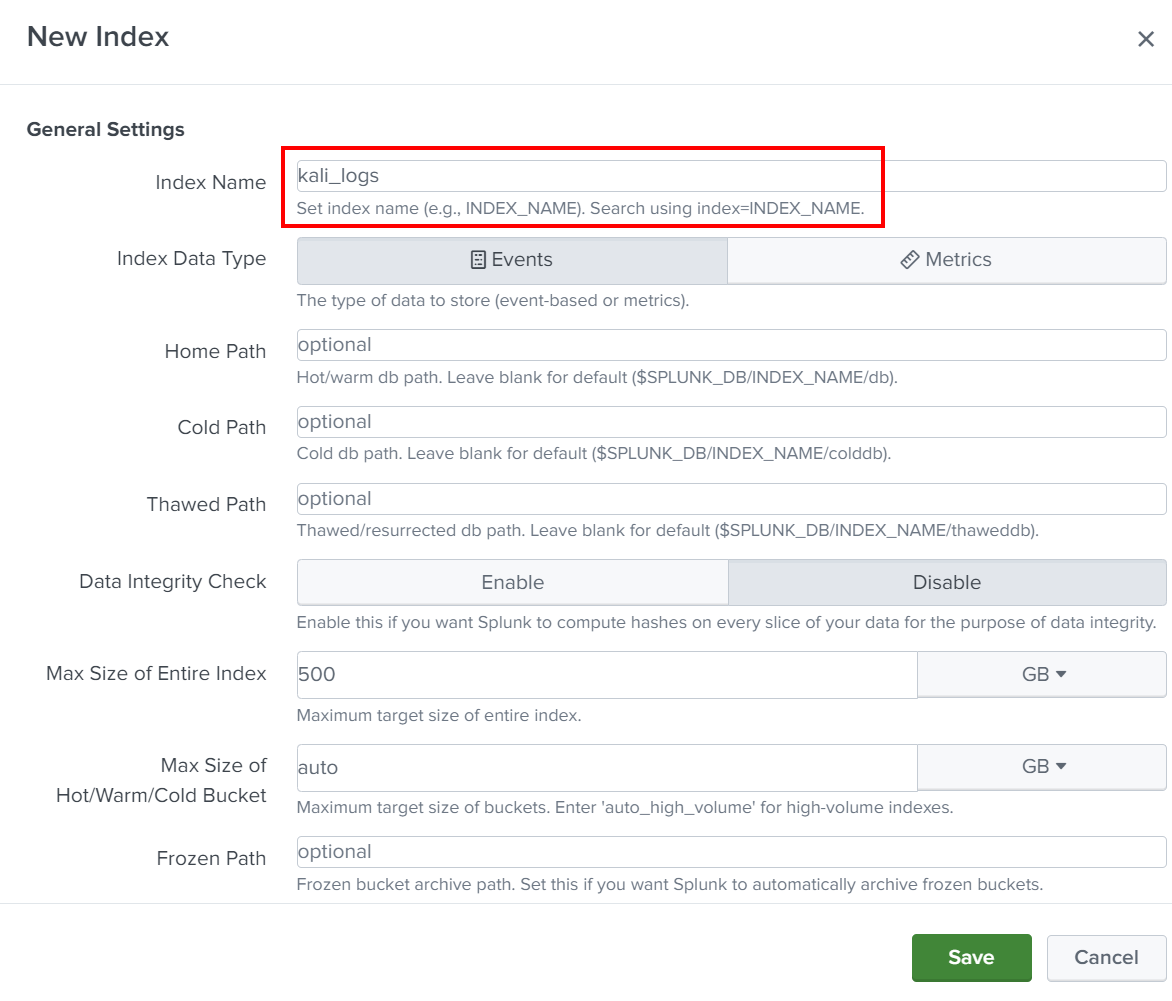
Configuring Linux Splunk Forwarder
Now let’s go back to the Linux machine and configure it to send logs to the Splunk server using:
./splunk add forward-server <SPLUNK_ENTERPRISE_SERVER_IP:9997>
Let’s restart Splunk to apply the changes.
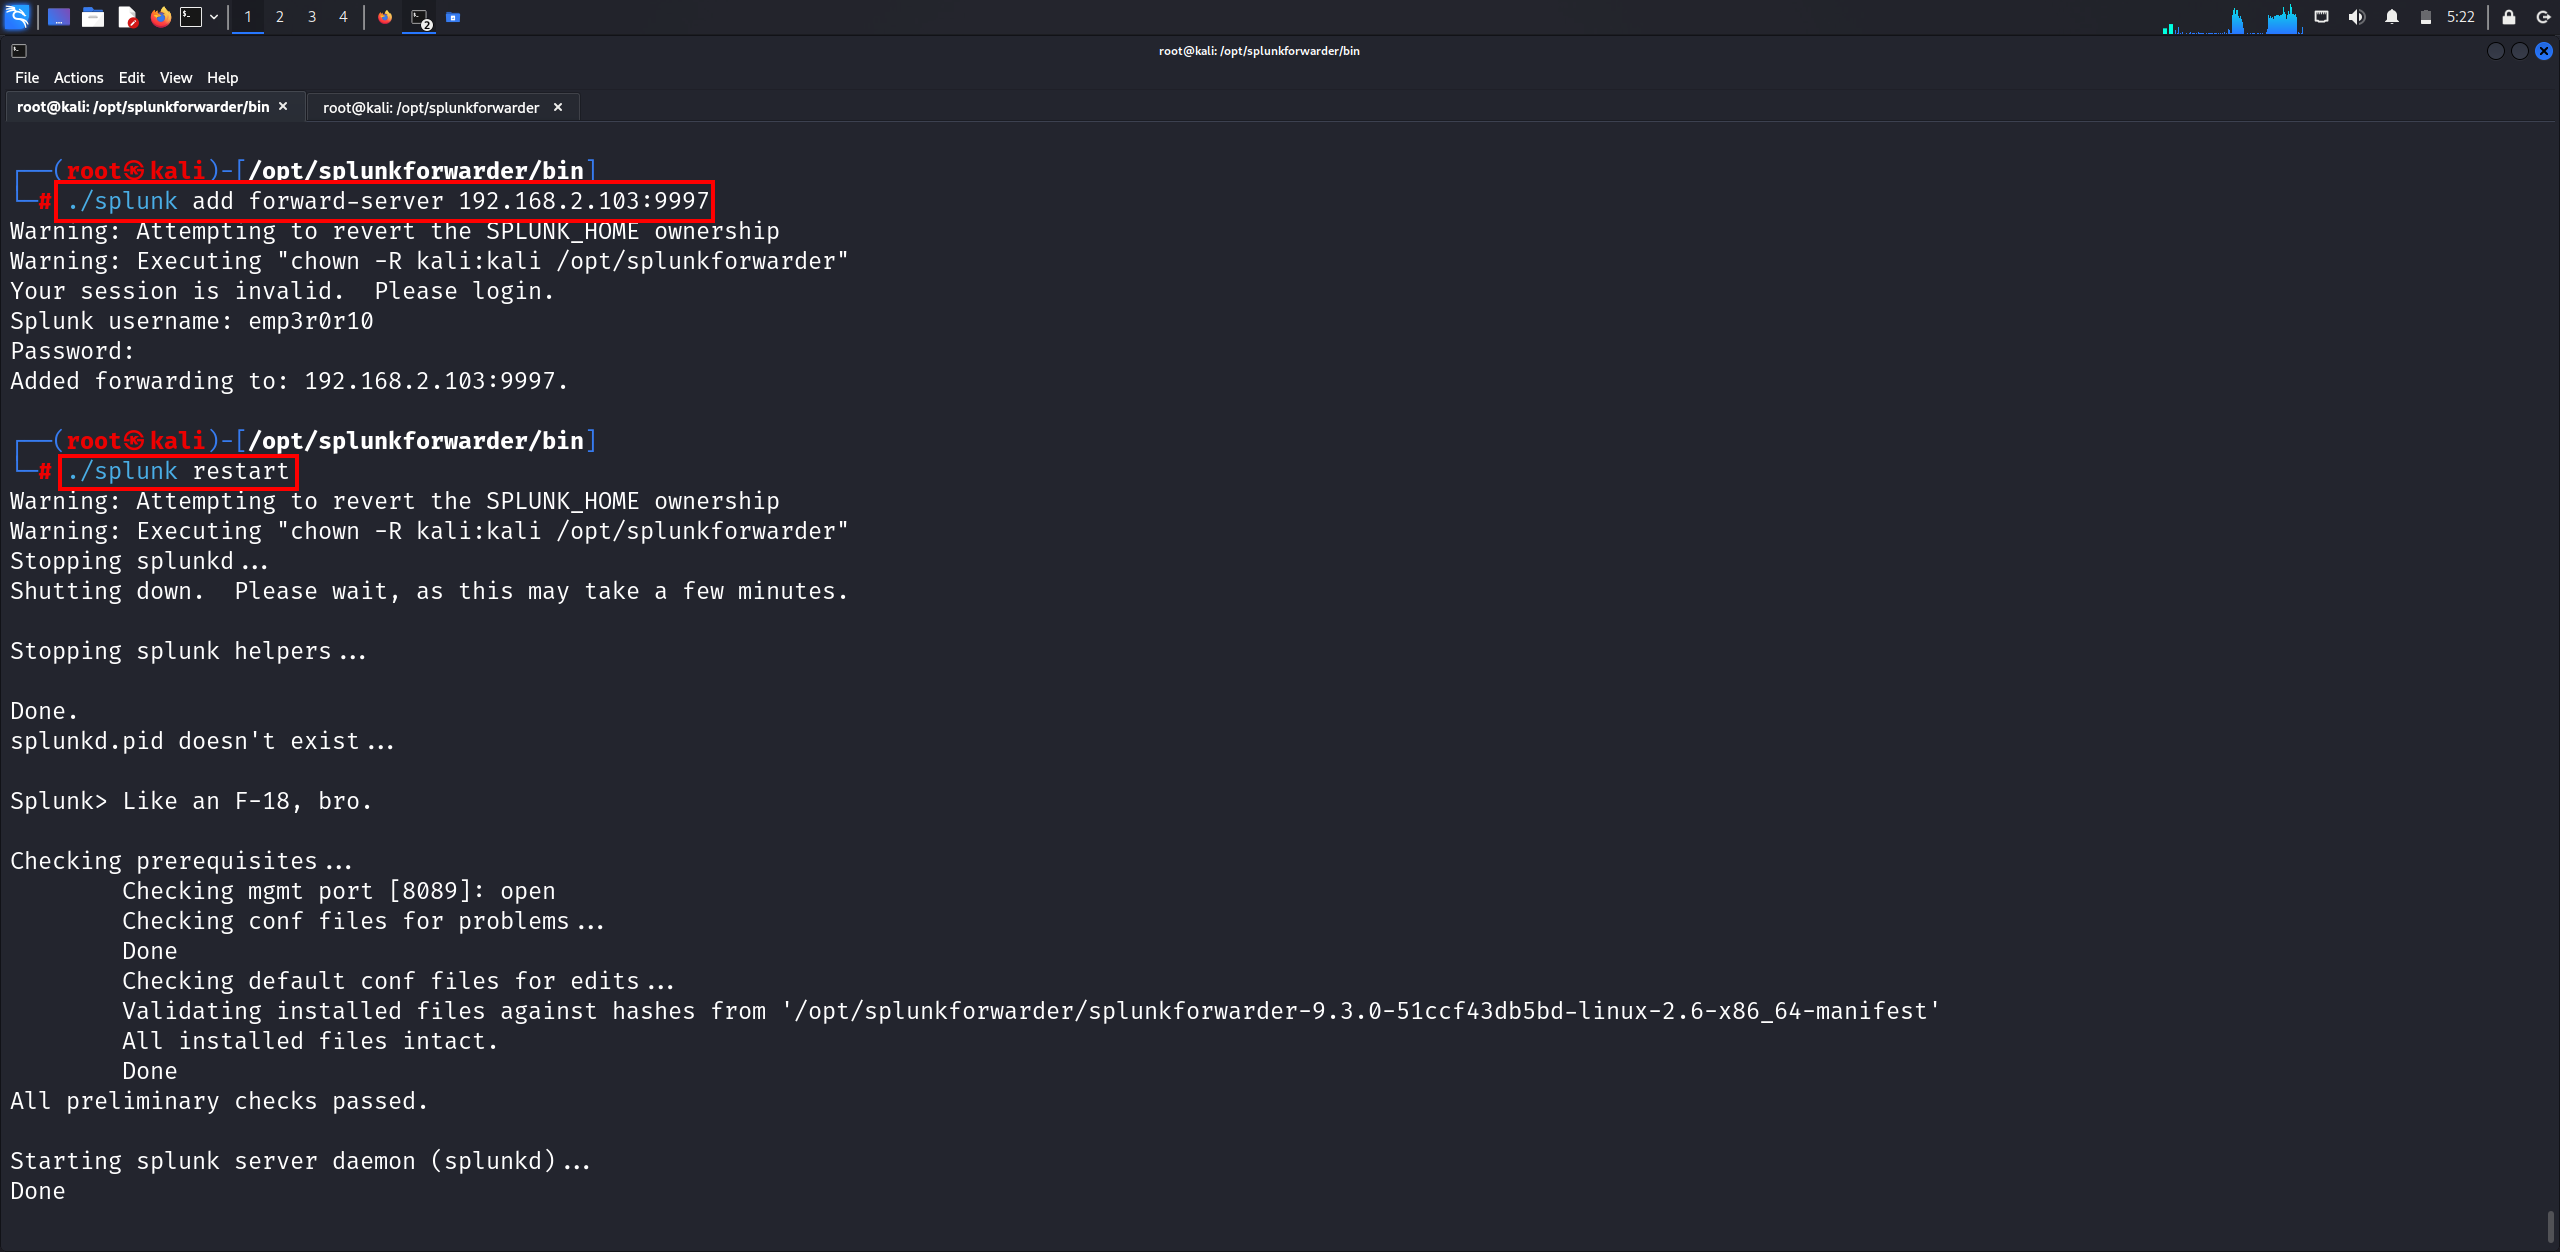
If we go to the Splunk server, we can’t find any hosts because we haven’t monitored the logs. So, let’s monitor logs in the /var/log directory.
/var/log contains logs from the OS itself, services, and various applications running on the system. It’s like an
Event Viewerin Windows
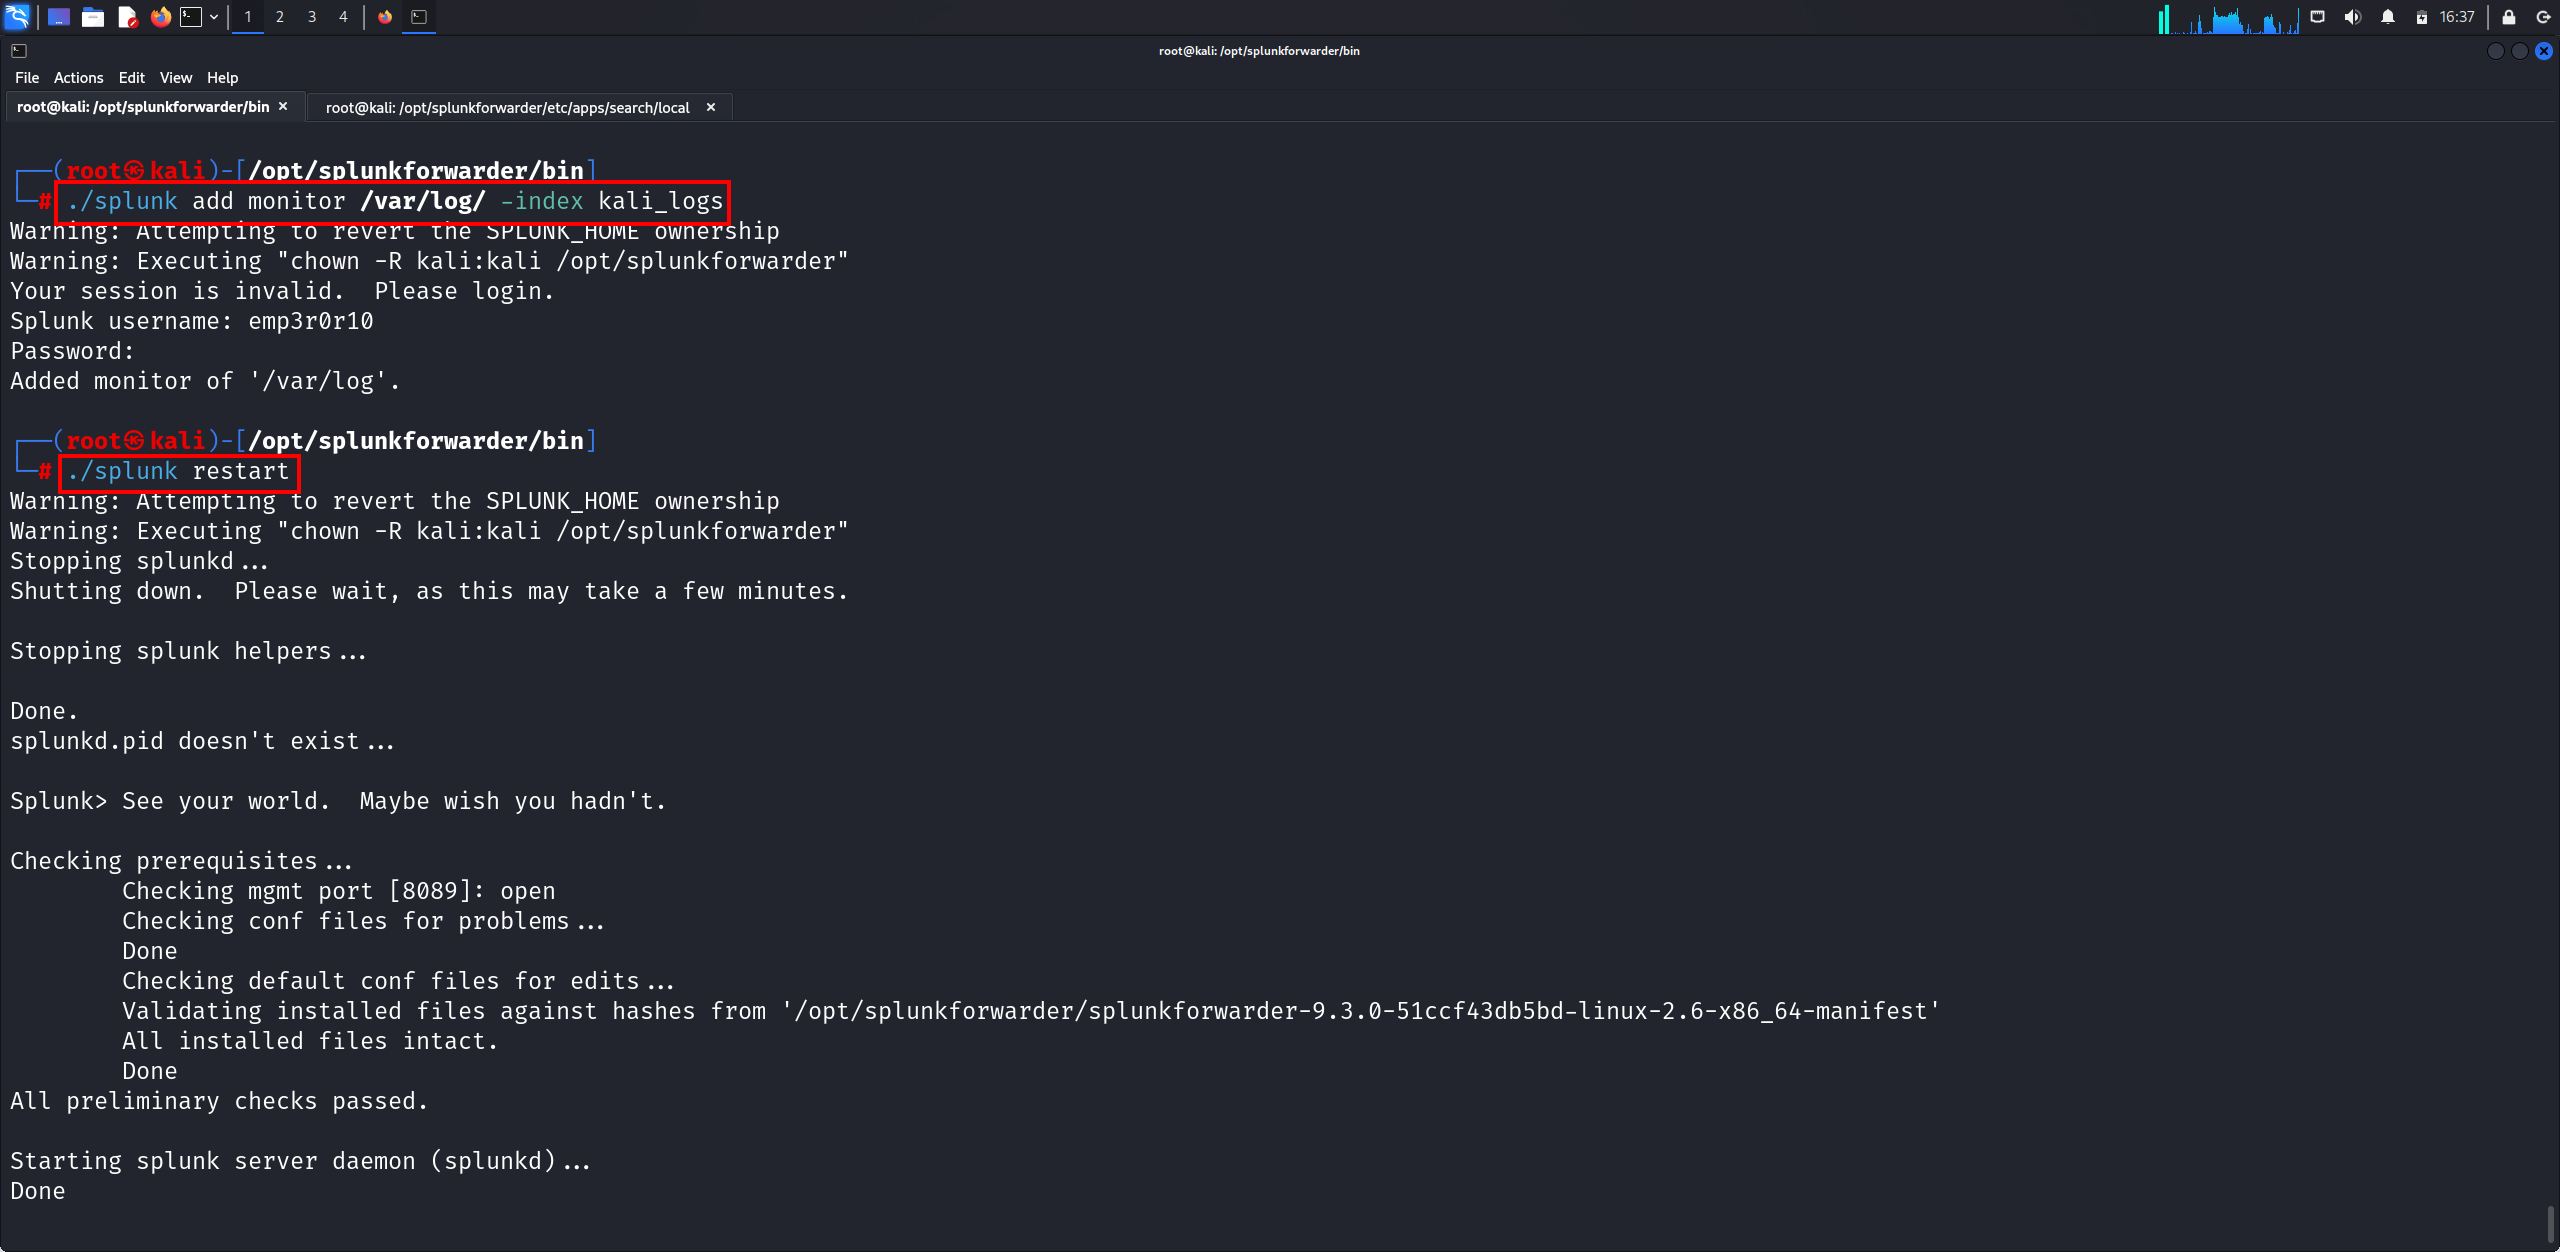
Viewing Logs in Splunk Enterprise
After configuring the forwarder, let’s go back to Splunk Enterprise (Windows VM) to check if the logs are coming through.
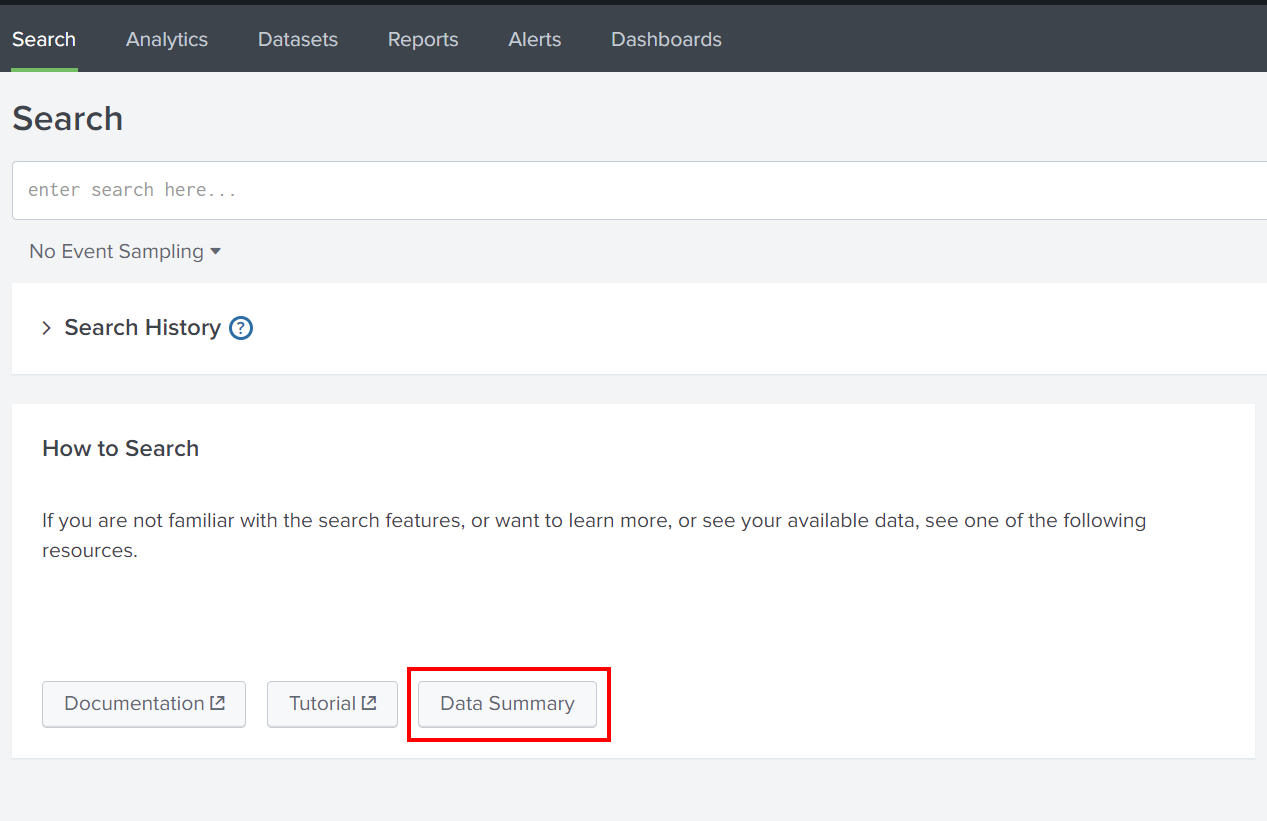
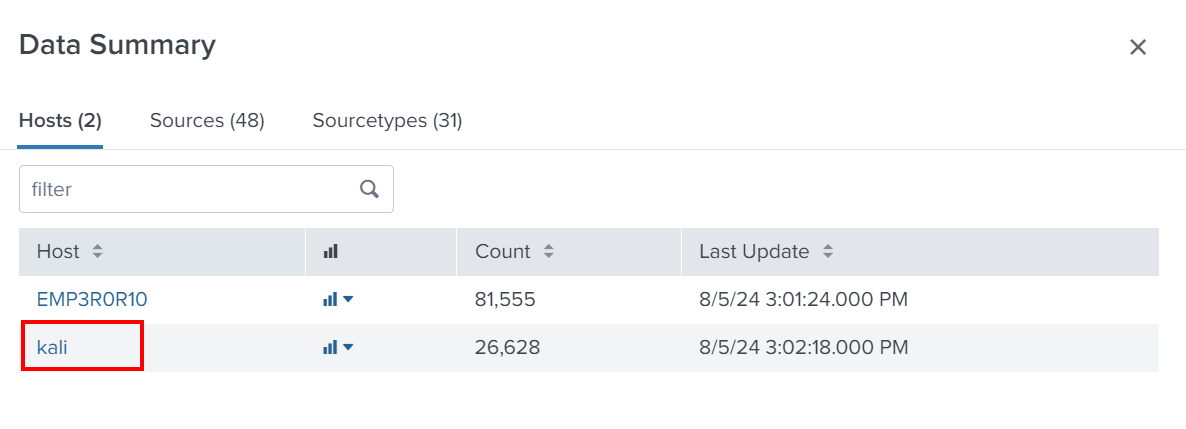
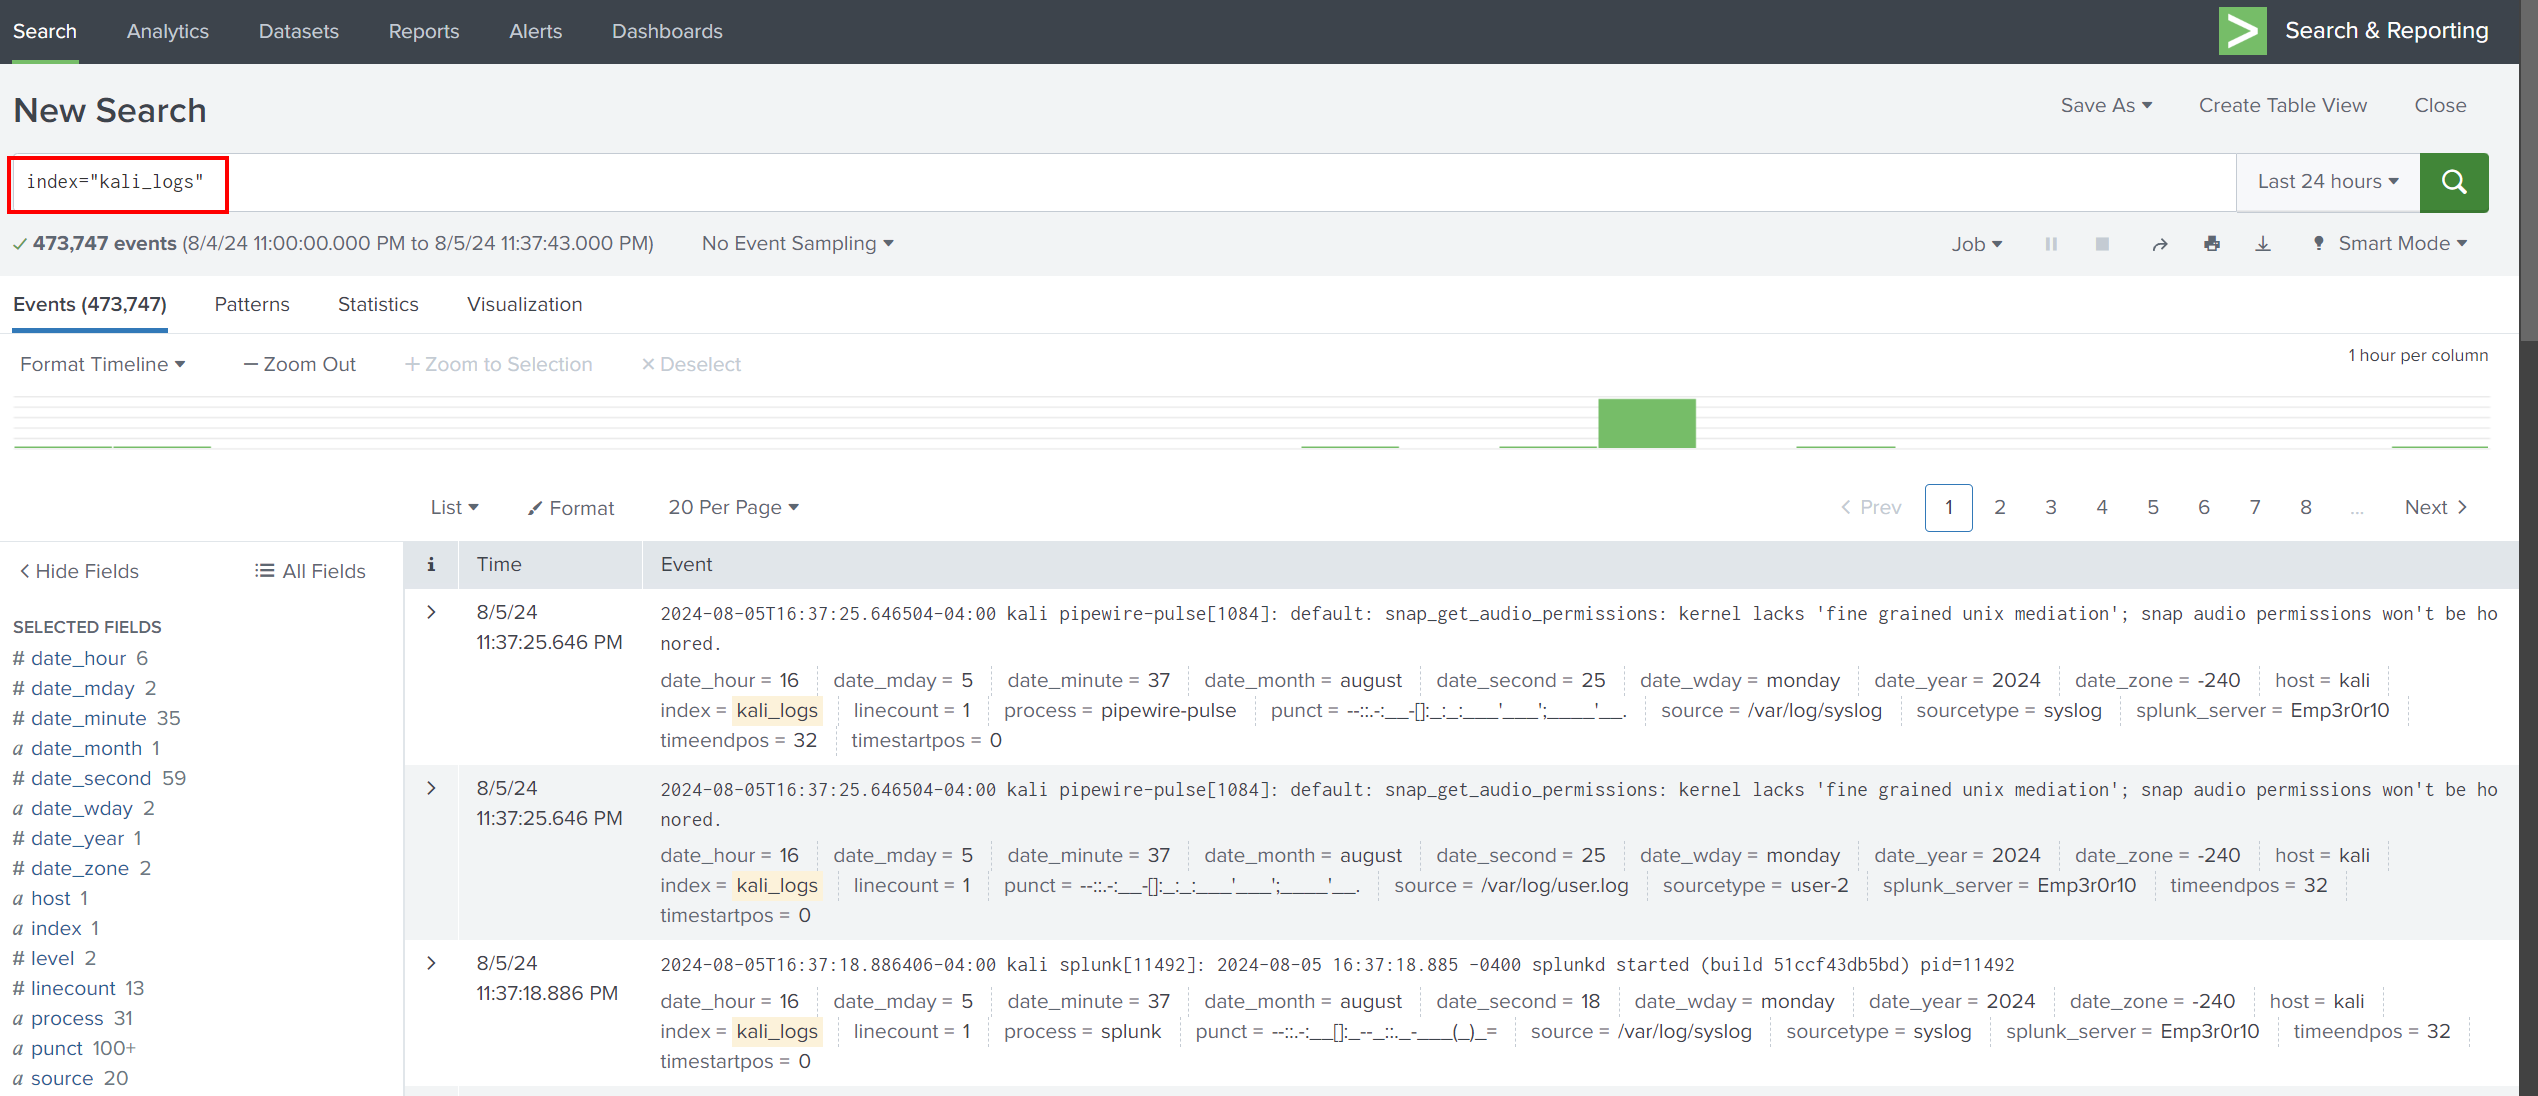
If we search for the kali_logs index, we can see all log files in /var/log here.
Attacker Simulation: Directory Brute-Forcing
On the Linux VM (Kali), install and start Apache2 and SSH services. These services generate logs that Splunk can monitor. Use the following commands:
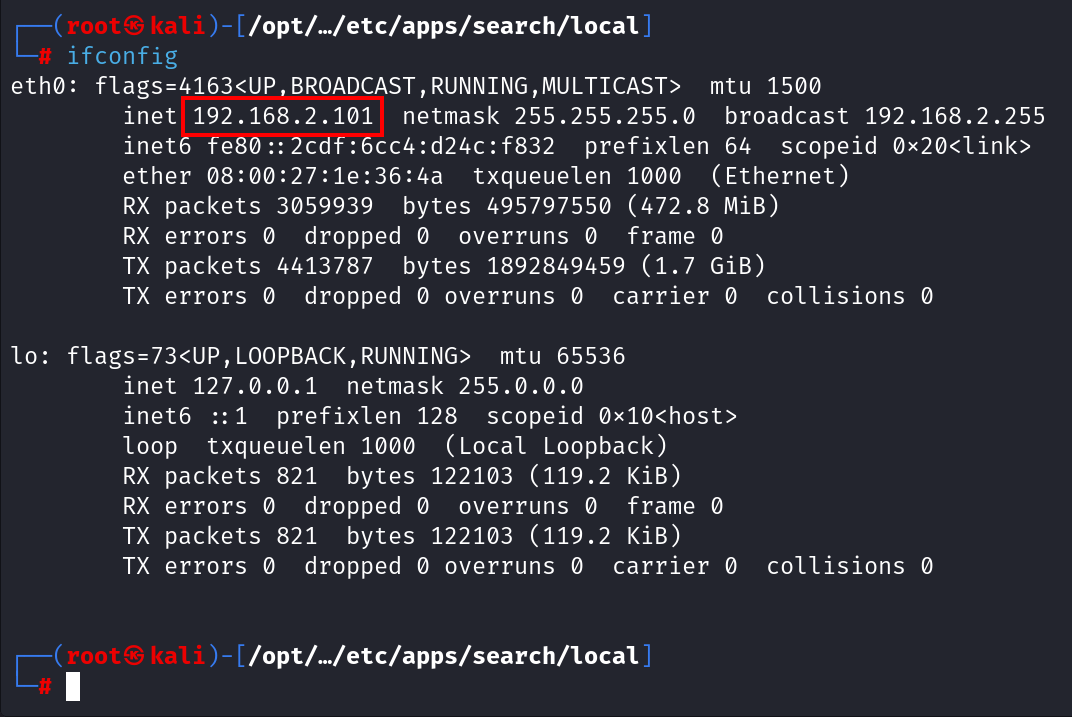

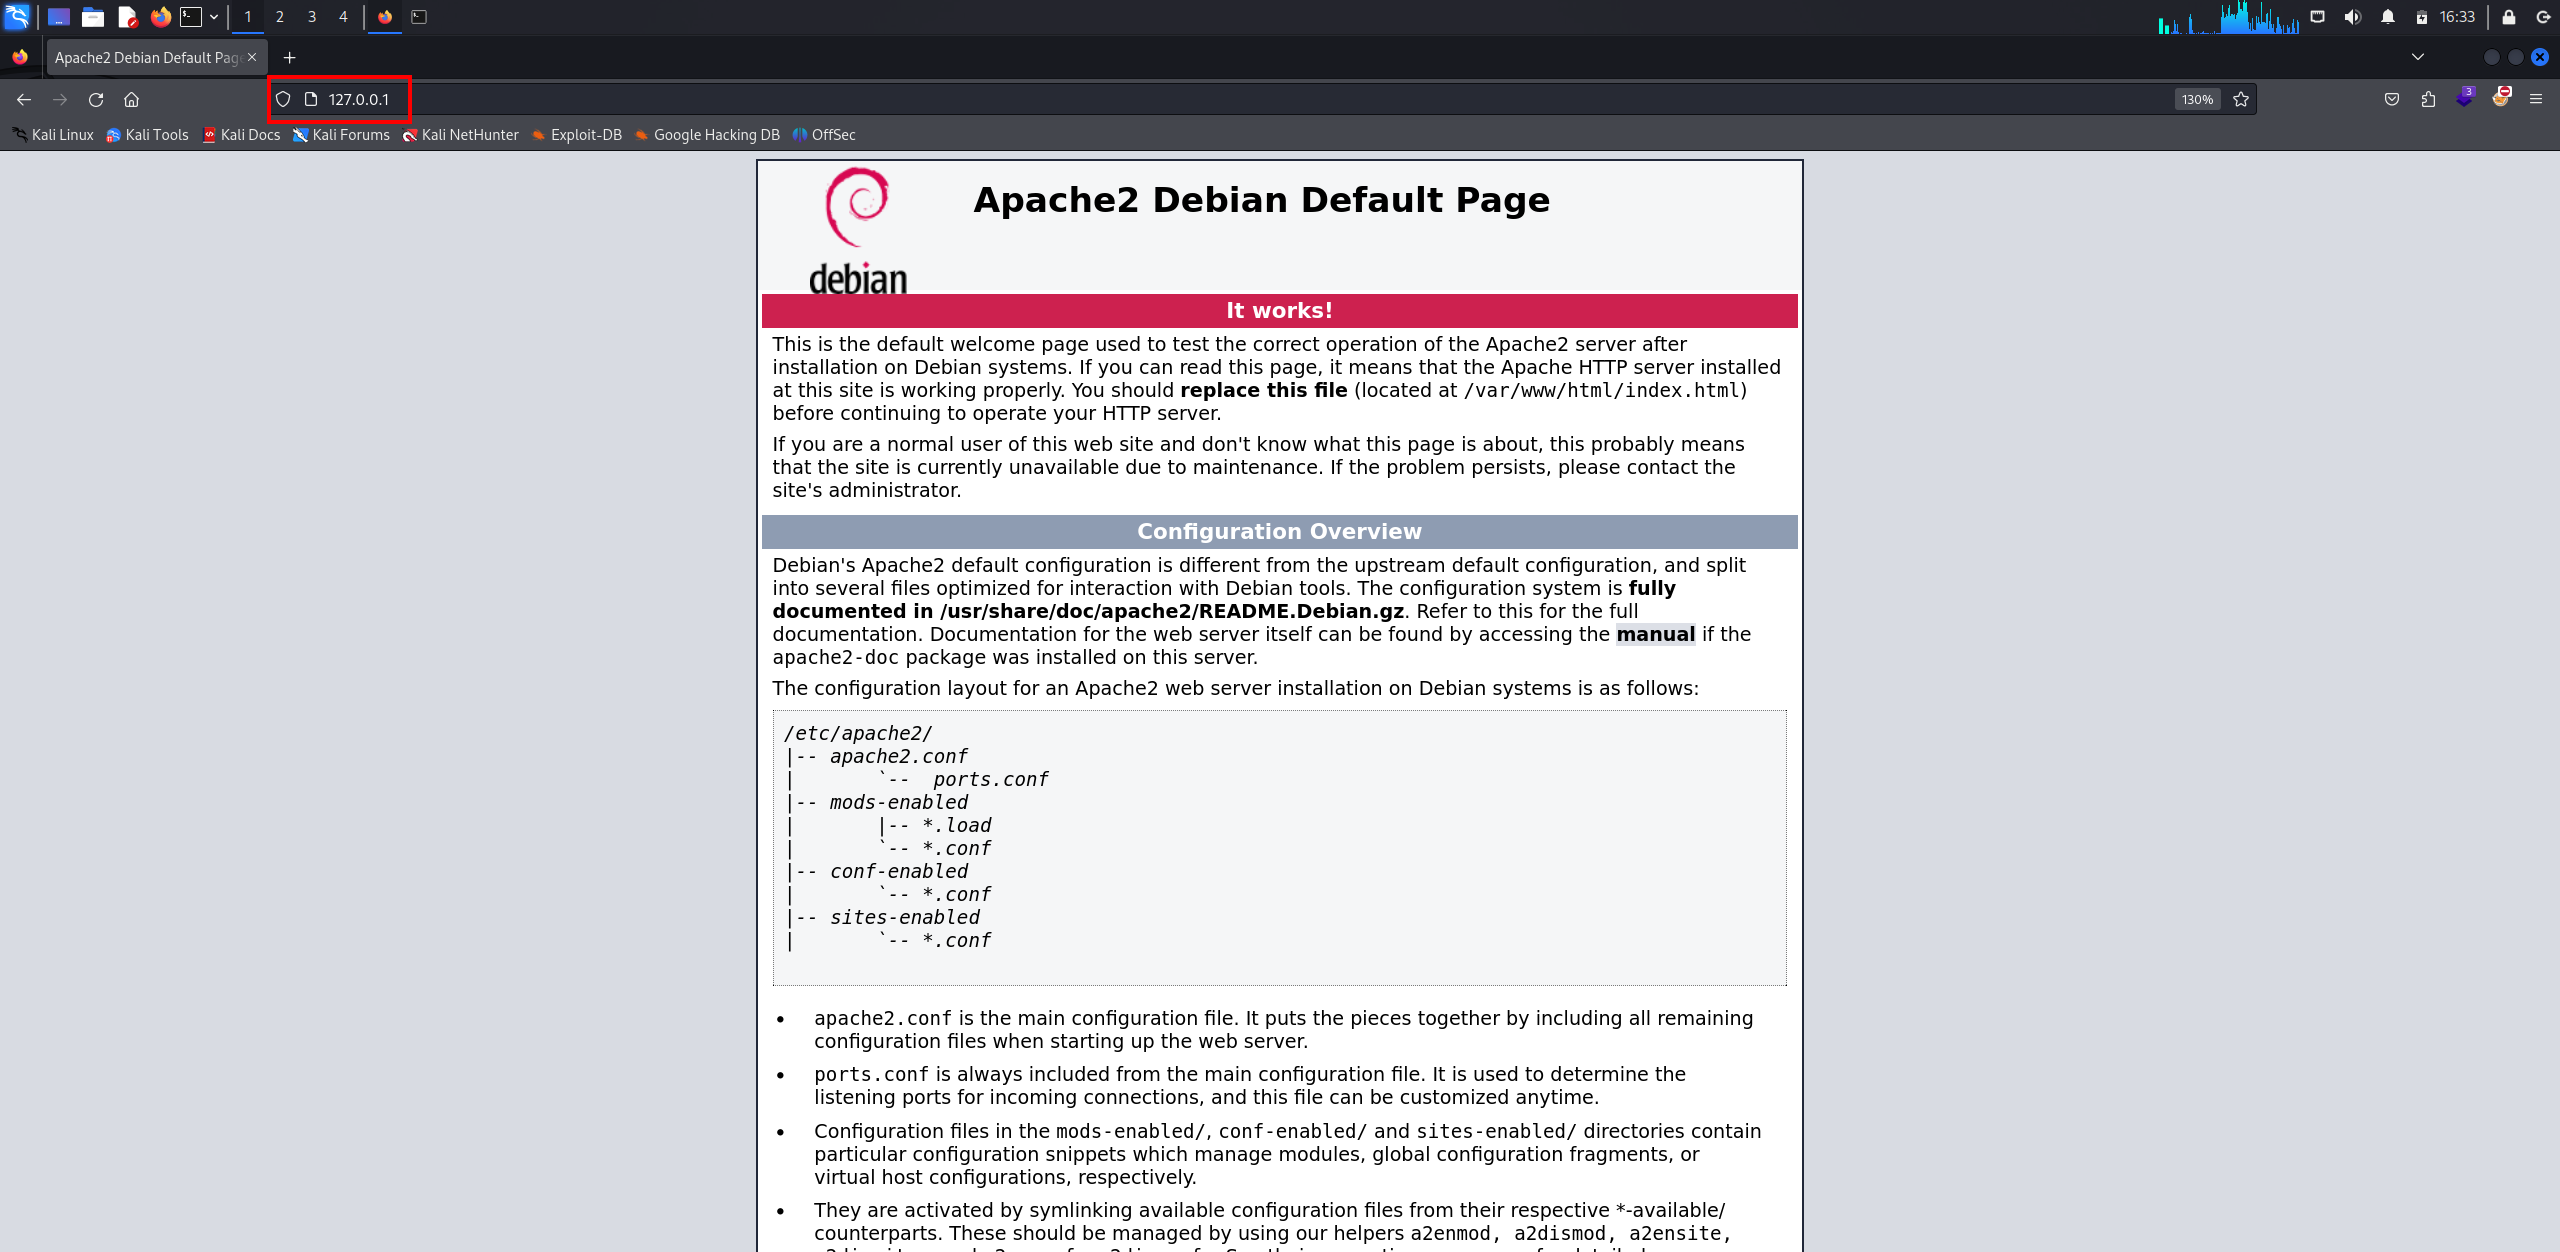
Let’s check the connectivity and go to http://127.0.0.1/.
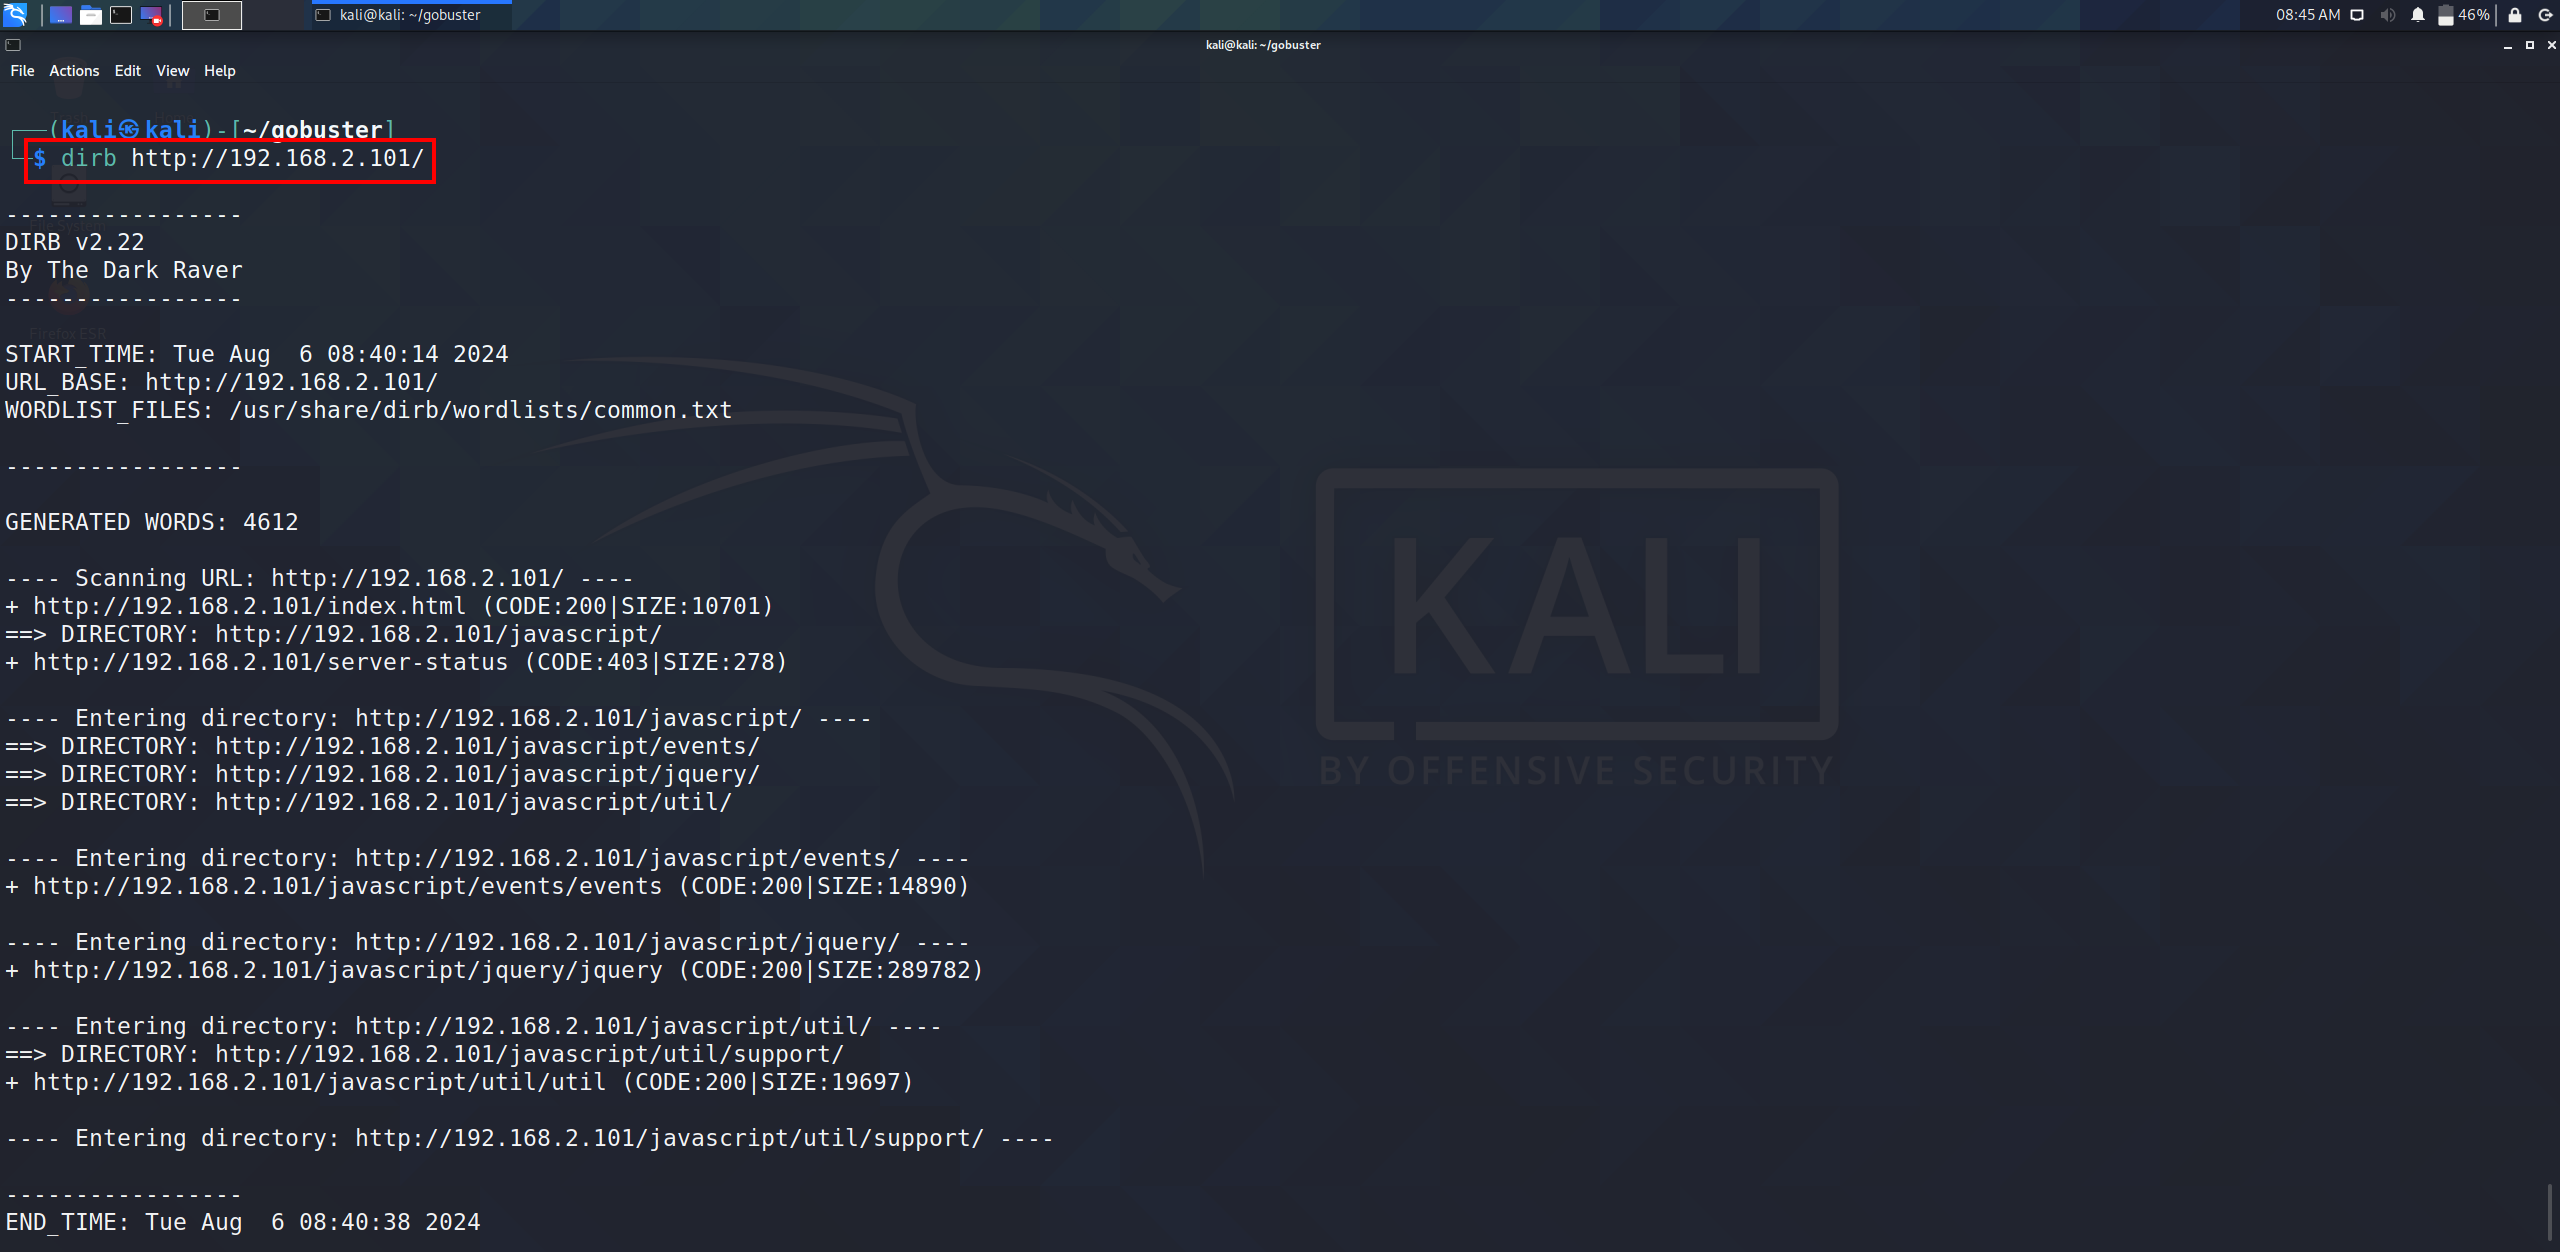
Now, simulate an attack using dirb from the attacker machine (Linux VM) against the running Apache server.
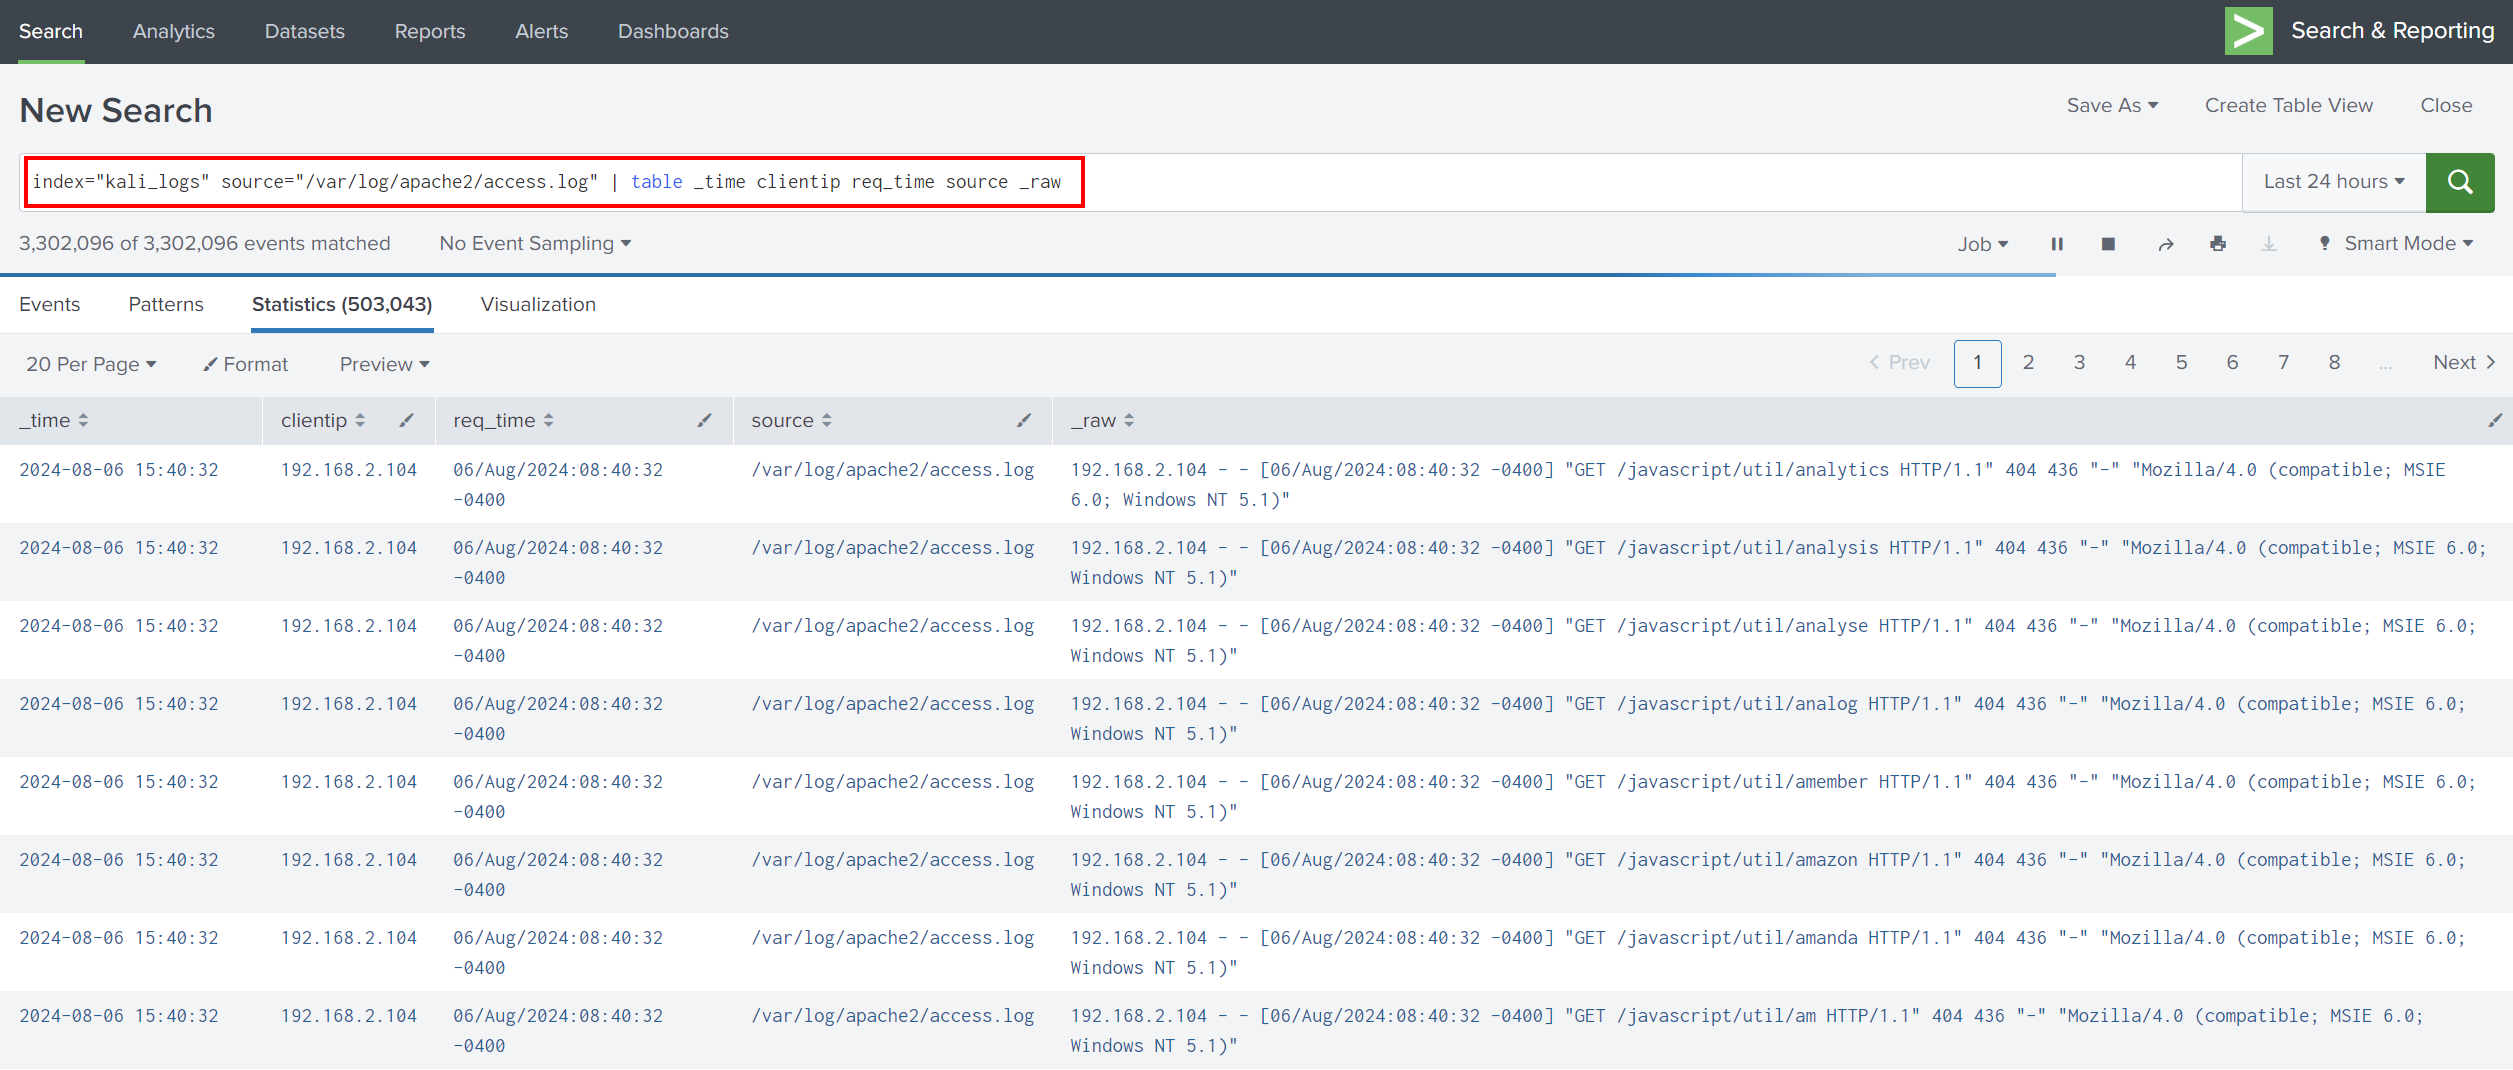
If we go back to Splunk search and search for logs in /var/log/apache2/access.log, we can see dirb requests logged in /var/log/apache2/access.log
As we learned from the previous part, we look at interesting fields and search for them in a tabular format to have a better view.
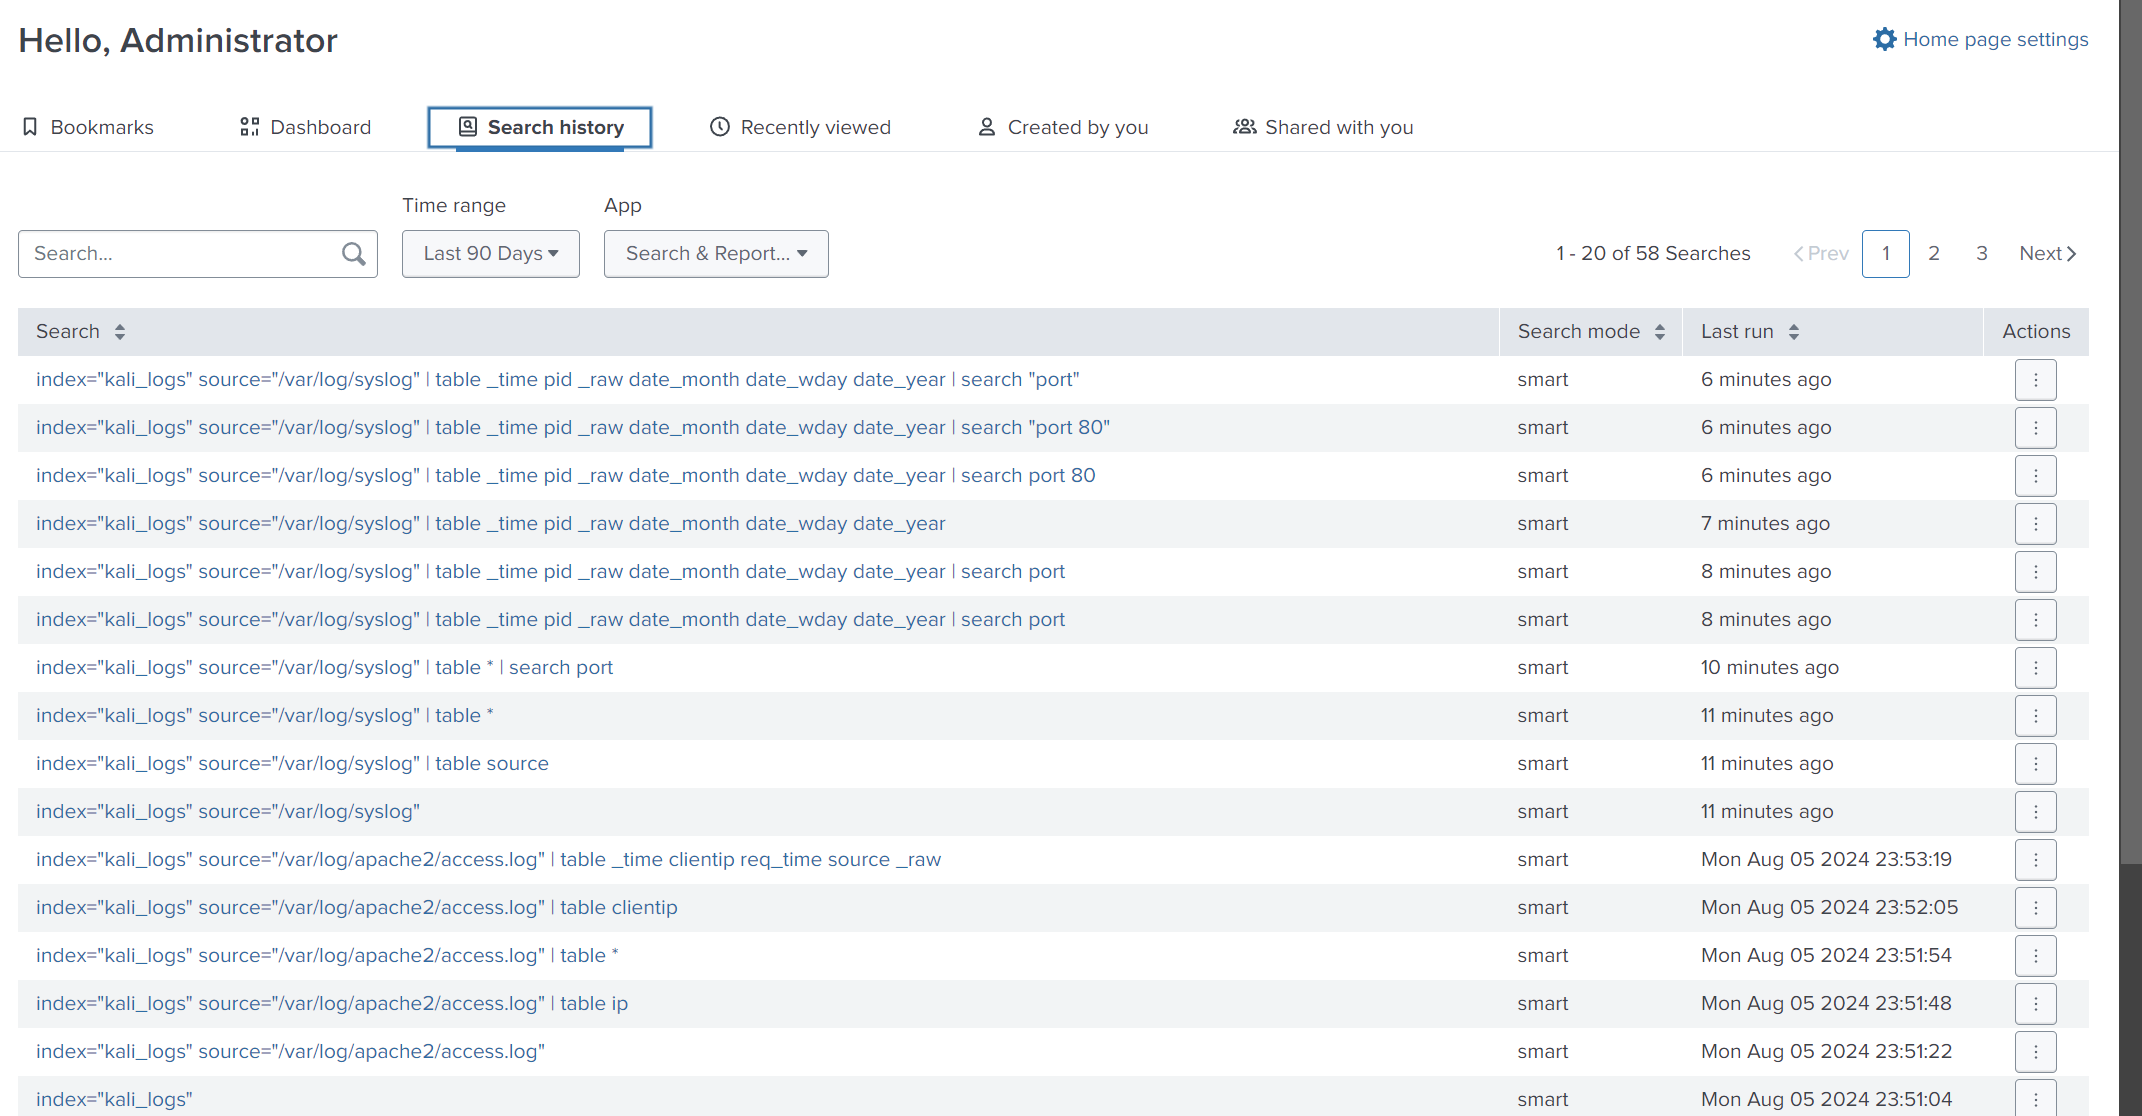
Don’t forget, if you want to search for something you have searched for before, you can go to Search history.
Creating Alerts for Suspicious Activity
As we see above, an attacker tried to brute force directories, which may be suspicious activity for specific companies. So, we can create an alert for this suspicious activity.
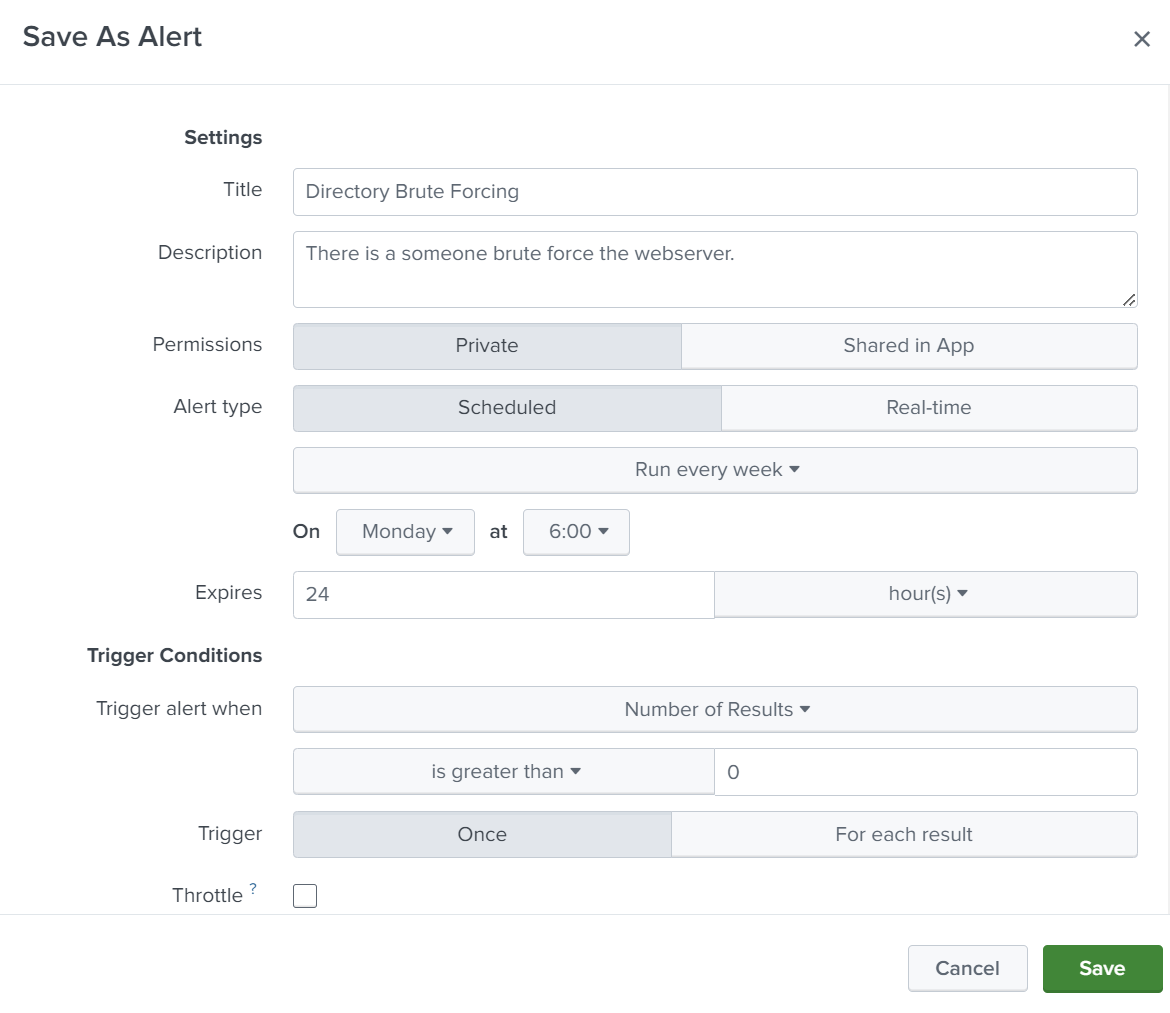
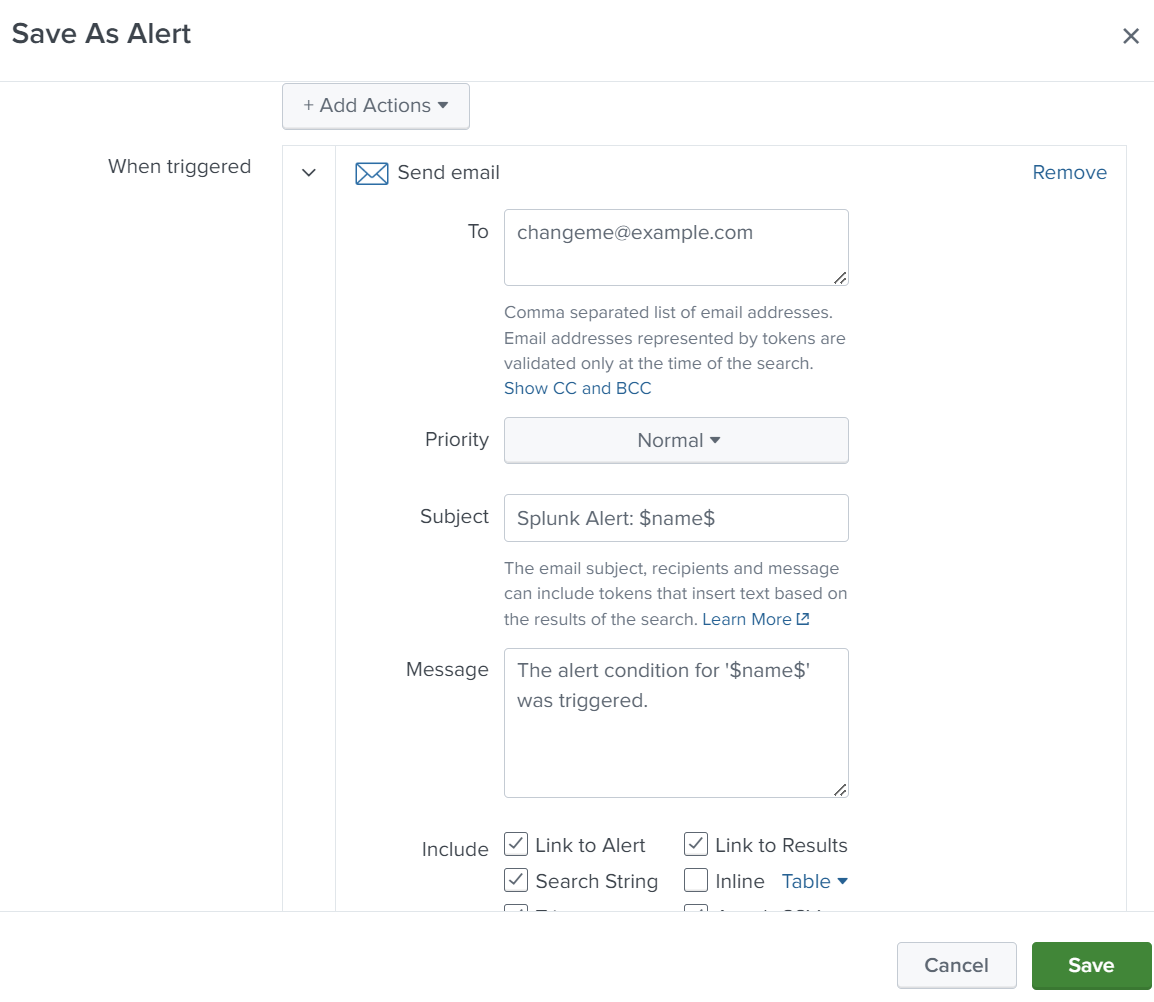
We can set an action to send an email if an alert is triggered.
Resources
Tryhackme - splunkexploringspl
Tryhackme - splunkdashboardsandreports
Tryhackme - splunkdatamanipulation
Conclusion
In this tutorial, we successfully forwarded logs from a Linux machine to Splunk Enterprise, simulated an attack, and analyzed the logs using Splunk. As a summary:
- Part 1: Introduction to logs, monitoring, and SIEM solutions.
- Part 2: Introduction to Splunk, its components, and hands-on practice with a demo.
- Part 3: Set up a home lab with Splunk Forwarder and analyzed attack data.
If you find this tutorial helpful, you can follow me on Twitter for more updates. Keep going!
Thanks for reading.